
Tech 2 BPO Prices Post Crius
Posted: 2014-11-14 Filed under: industry, market | Tags: bpo, crius, tech2 2 Commentstl;dr Sale prices for Tech 2 BPOs are down an average of 47% after the Crius release.
Overview
Over the past few years I have been watching prices for publicly traded Tech 2 BPOs and attempting to record the values to the best of my ability.
Some sales completed non-publicly, some were vastly inflated, and some never sold. There is most certainly a lot of inaccuracy in the datapoints given the speculative nature of the Tech 2 BPO market, yet they still serve as guiding value to help us value the BPO.
The Post Crius Marketplace
The volume of posts in the official Sell Orders section of the forums are down, sellers are getting trolled, and people are re-running numbers to reprice the value of the BPOs trying to justify a much lower cost. I’ve seen a lot of CCP Dev intervention to clean up threads and keep people on topic. Overall the market is rather anemic.
Numbers
CCP Greyscale Comments on Tech 2 BPOs
Posted: 2014-04-28 Filed under: industry, market, ships | Tags: bpo, broadsword, claw, claymore, huginn, mastadon, muninn, revelations, tech 2 3 CommentsWe got hit with two industry Devblogs today as it looks like CCP is going to try to publish all six industry related blogs before Fanfest. On page 9 for the comments for the Researching, the Future post, CCP Greyscale made a comment on how much Tech 2 BPOs dominate the market.
Right, Mastadon, Claymore, Claw etc are BPO-dominated, so in practice all this means is more throughput and (presumably) cheaper prices.
Huginn and Muninn are in the area of concern, where we might end up warping the market a little.
Broadsword’s not a concern because it was released in Trinity (winter 2007) and to the best of my knowledge we stopped putting new ship BPOs into the lottery in Revelations 1 (winter 2006). If that market’s uncompetitive, it’s because of your fellow inventors, not BPO owners 🙂
This adds a little more information from what we got out of CCP Diagoras before he left CCP that I covered in my Percentage of Items from Invention vs Tech 2 BPOs post.
425mm Railgun I BPO Firesale
Posted: 2014-04-18 Filed under: market | Tags: 425mm railgun i, bpo 1 CommentWith the upcoming compression changes outlined in the Building Better Worlds devblog, our stock of 425mm Railgun I BPOs became instantly useless for compressing minerals. They were researched to ME250/PE50, but I priced them at their NPC value of 15M as a firesale in order to get them to move. I was able to sell our stock within a week.
So long Railgun BPOs, you will be missed.

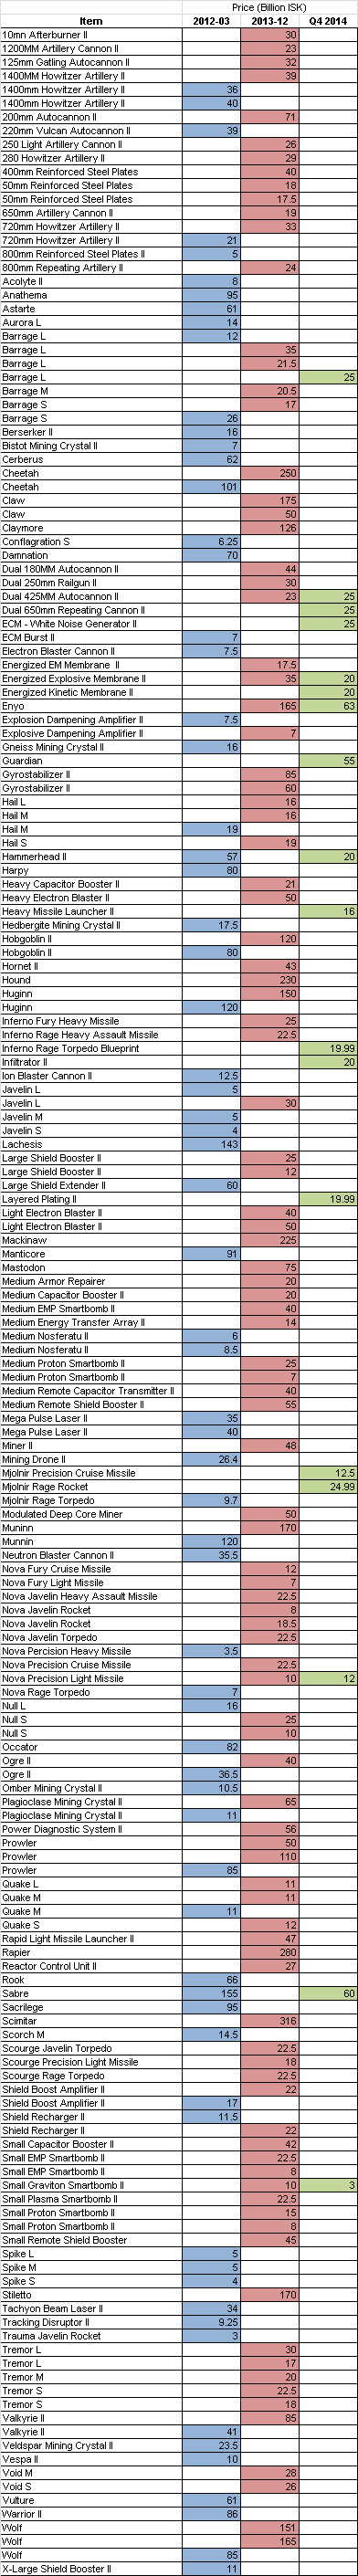
Historical Tech 2 BPO Prices
Posted: 2013-12-18 Filed under: history, industry | Tags: bpo, tech 2 1 CommentDisclaimer: Account for a large amount of inaccuracy with the price records that I have for Tech 2 BPO sales. The numbers that I have recorded are from scanning official and unofficial forums, chatting with industry counterparts, and some of the values have a price correction built into the value based on a ‘best guess’ from the record of a sale.
Is it better to trade or produce off of a Tech 2 BPO?
It turns out that it depends — the Tech 2 BPO market is highly speculative and subject to swings in price based on an items popularity given trends in balancing, fleet doctrines, or the sheer collectibility of the item. The prices that I have been able to record have been mostly public record. I’m sure that there is a tier of players that deal with blueprints off the record in private backchannels.
Data Scope
Taking data that I have from my previous post on Tech 2 BPO Returns, I did another scan of prices and added them to my records. This gives me a sampling of prices from 2012-03 to 2013-12, a 21 month span.
Sale Prices
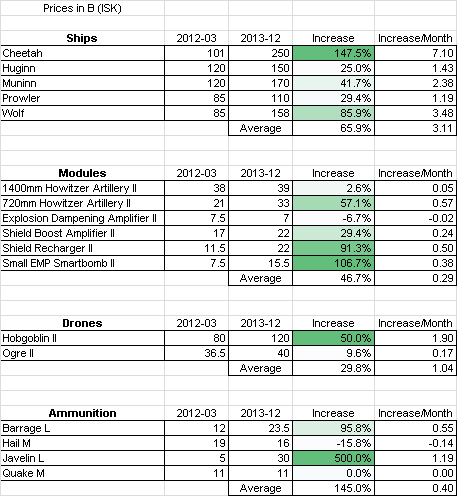
The performance of each item varied so I grouped them into ships, modules, drones, and ammunition.
Ship prices are the most stable return, modules second, and then followed by drones. Ammunition seems to be a volatile market; I am not surprised with the Tech 2 BPO value over time for ammunition as I have seen similar volatility with sales as noted in my Trading Performance: Ammo post.
Producing vs Investing
Using the Muninn as an example of a average performer and having the BPO in constant production would yield around 246 per year coming in at 50.683 M profit per hull, or 12.47 B a year of profit.
Our production profit would be around 1.04 B a month and my sheet on the increase of value shows the BPO increasing at 2.38 B per month. It turns out holding on to the print is more valuable than producing off of it.
tl;dr Conclusion
Invest in Tech 2 BPOs that fall under the ship and module category, produce off of them for a year, and resell the item for a higher value.
Spreadsheets in Space
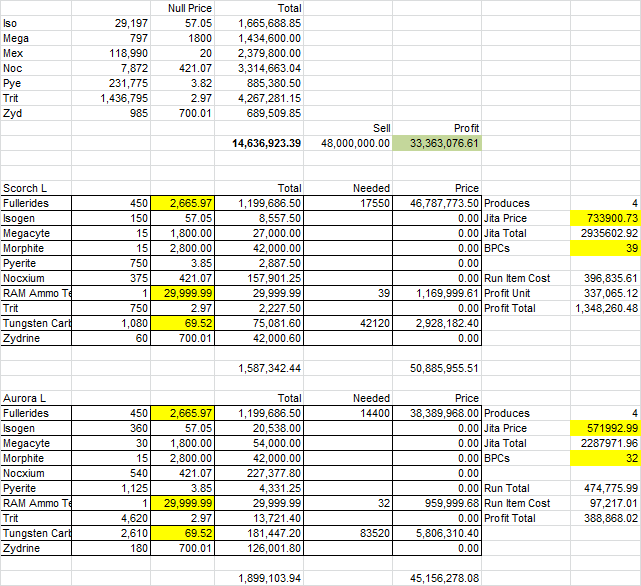
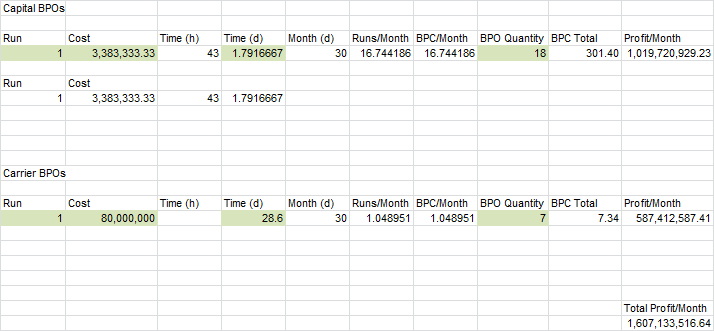
Posted: 2013-03-13 Filed under: eveonline, industry, market | Tags: anshar, aurora, bpc, bpo, carrier, pos, scorch, spreadsheet 11 CommentsMy side interest in information aesthetics is present in my work, both professional and personal. I’ve received many comments on how clean and clear my analysis charts, reports, and spreadsheet work can be so I though I would share some of my Eve related spreadsheet work to inspire people.
Here are screenshots from depreciated spreadsheets that I used for industrial production, speculation, and fuel estimations before switching to a custom web-based solution that my partner, Raath, created.
My design goal has always been to use small type-face Arial text that is boxed and columned with important information highlighted in primary colors or shaded in gradients to denote best to worst status. Some of these sheets are old with broken formulas or outdated build requirements. Pay more attention to the organization rather than to the numerical content.
Ammo

Compression

Copy BPOs
Copy Capital BPOs

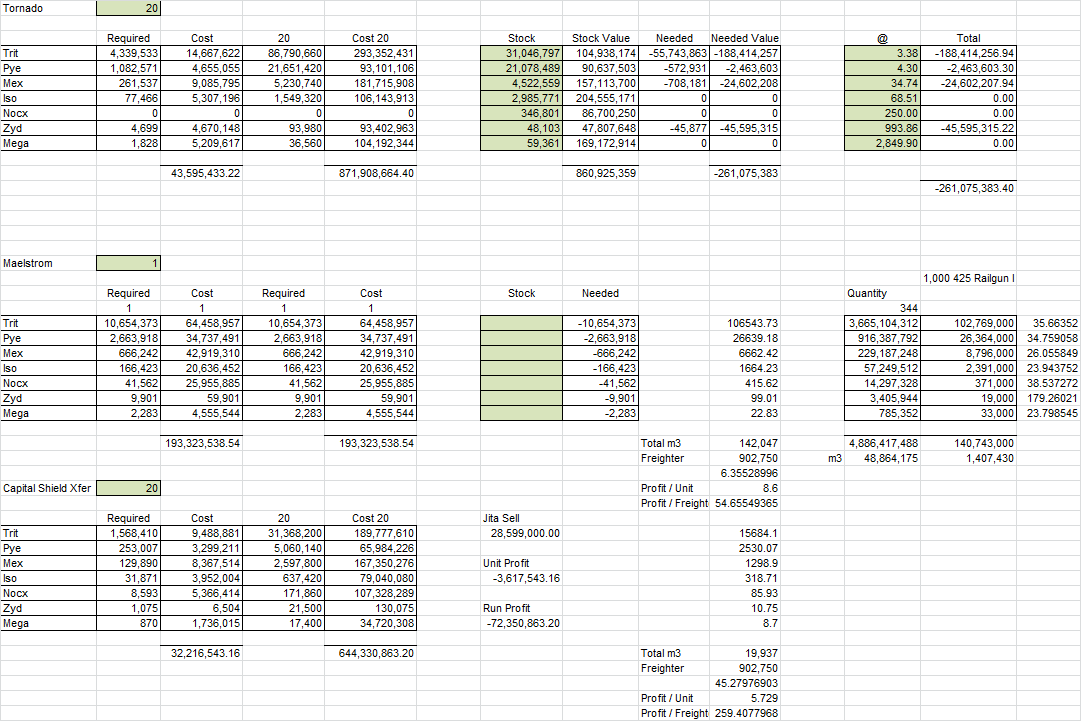
Freighter Construction
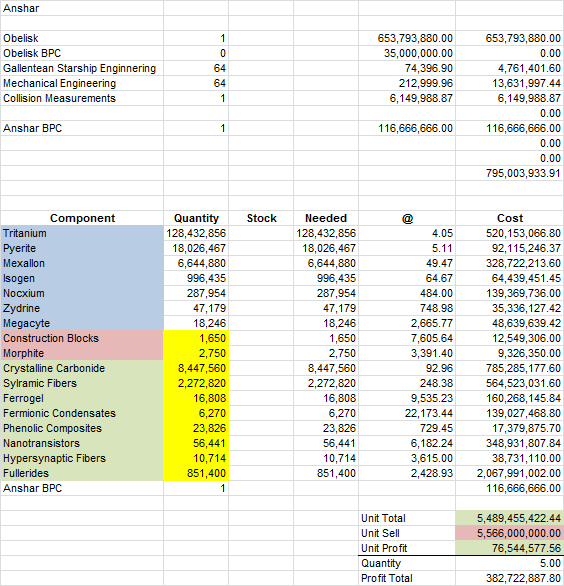
Jump Freighter Construction
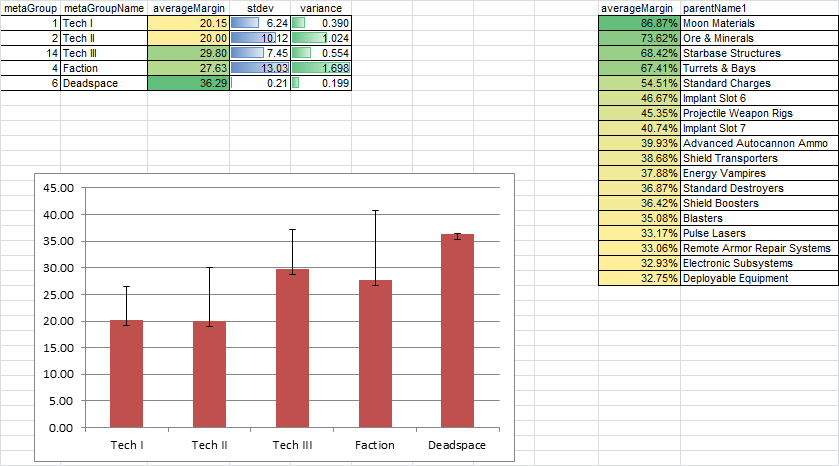
Margins
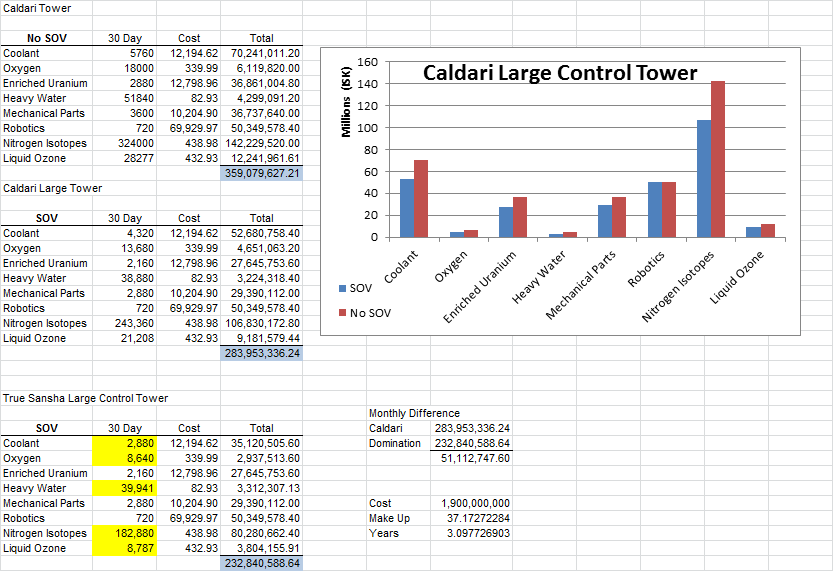
POS Fuel
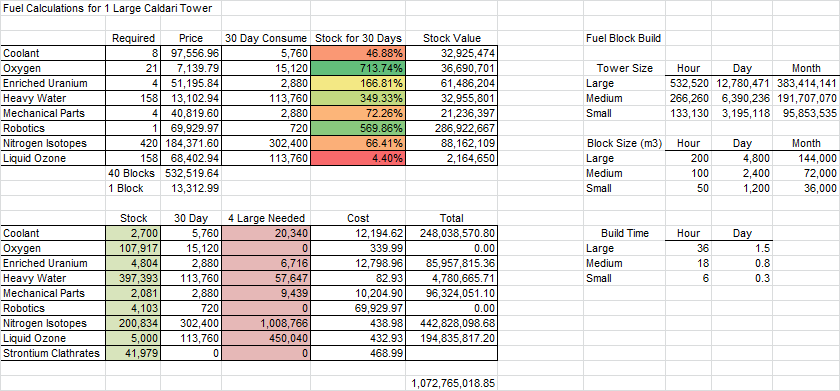
POS Fuel Blocks
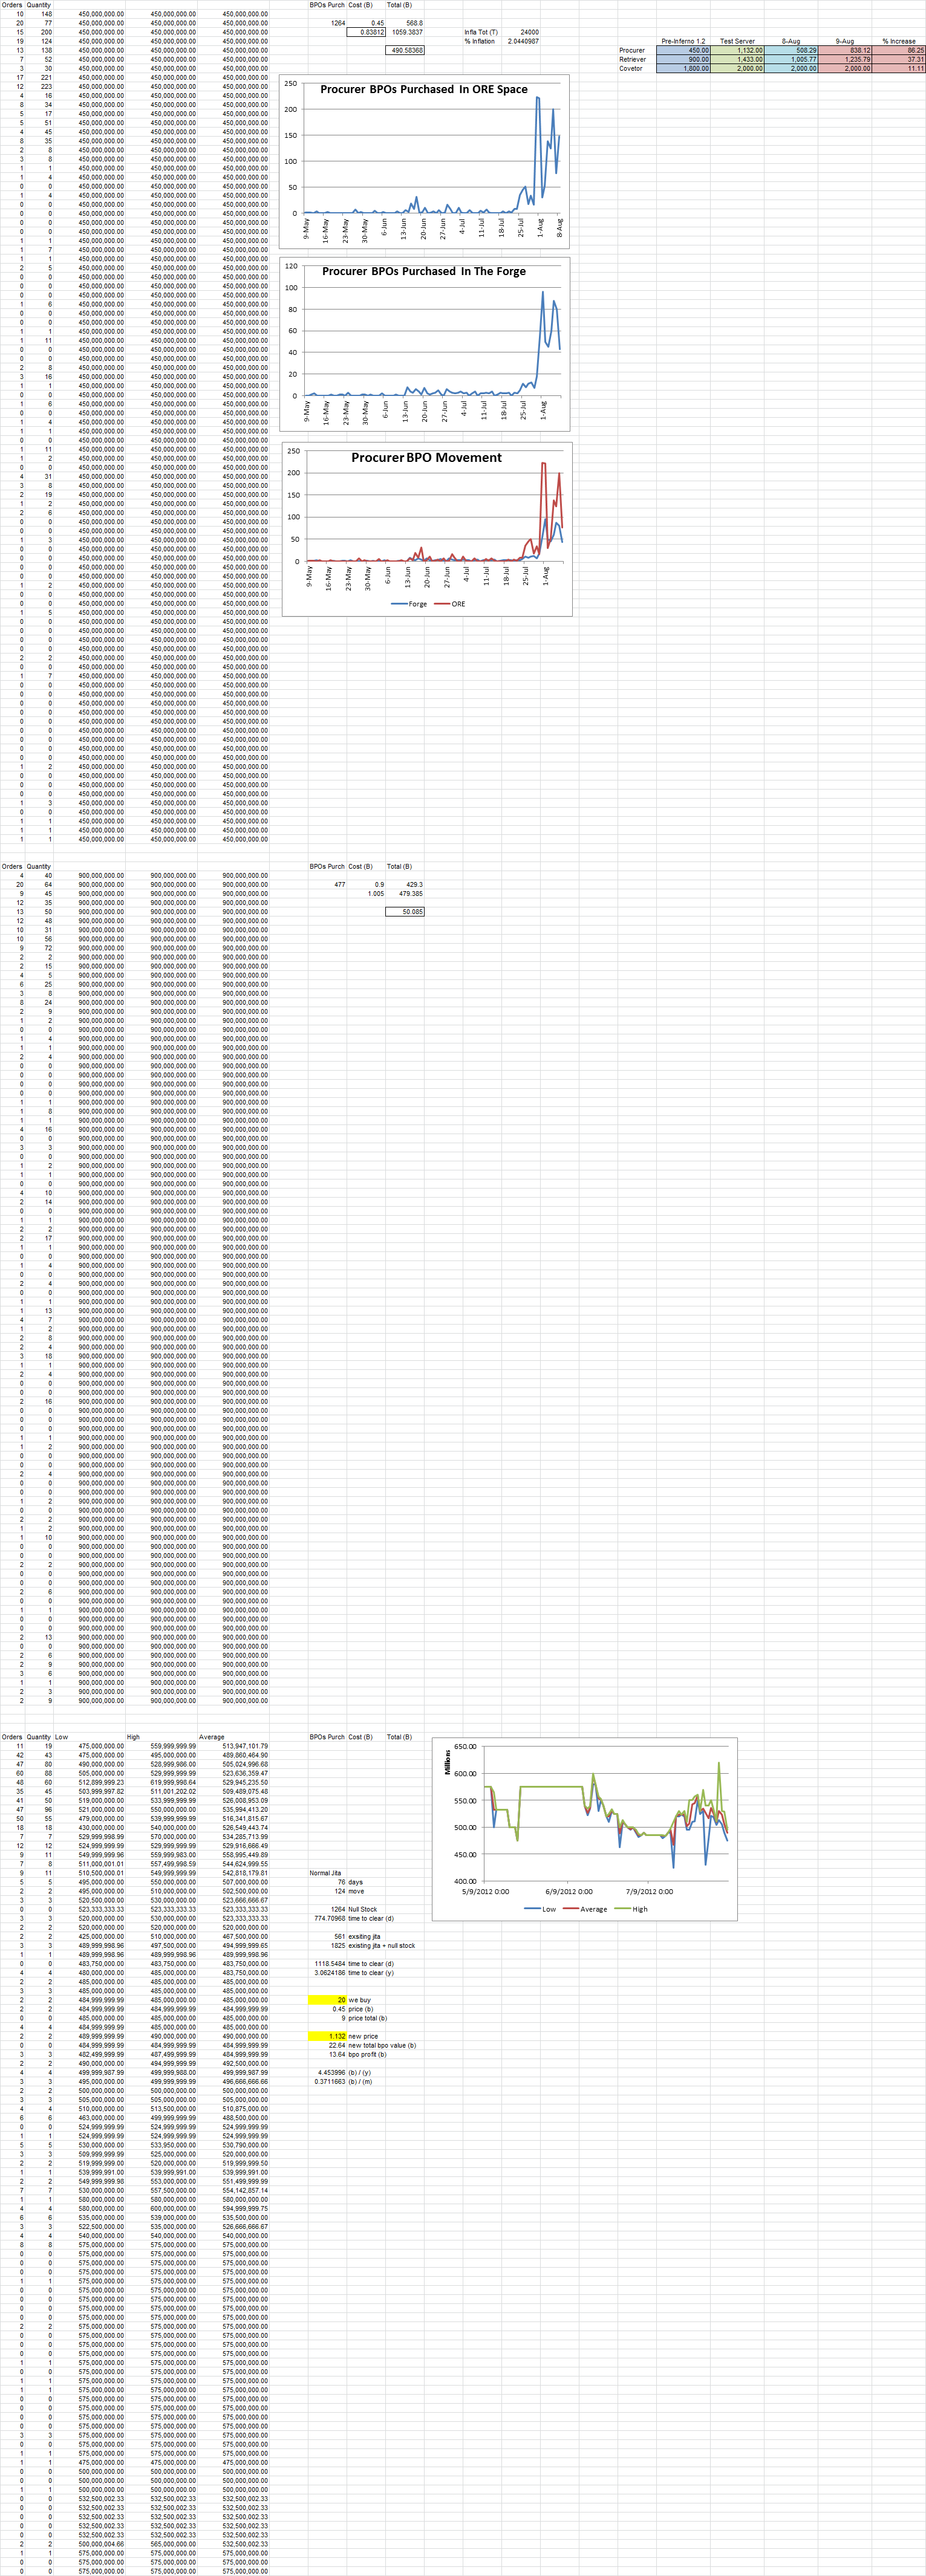
Procurer Speculation
Ship Construction
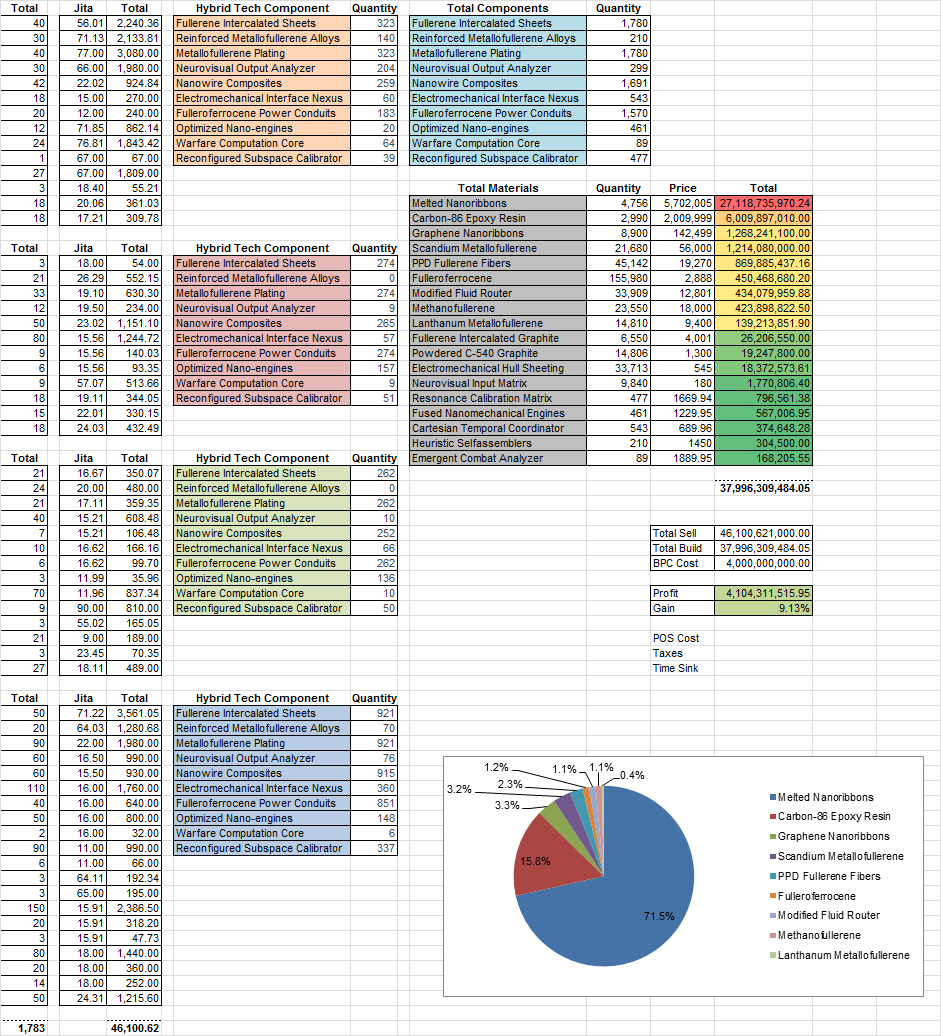
T3 Subsystem Construction
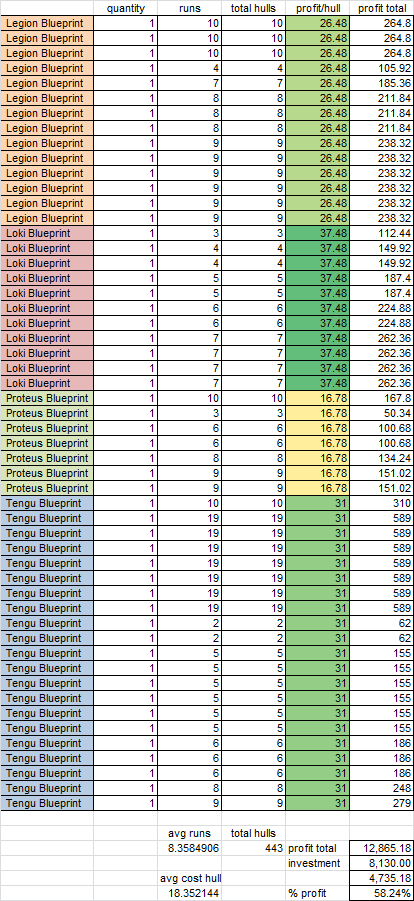
T3 Hull Construction
