
spotmarket – 0.3-dev
Posted: 2016-03-02 Filed under: market, python, spotmarket | Tags: d3.js, flask, pandas, r64, sansha 3 CommentsRapid Affirmative Coding
The last four weeks have been a rather busy development cycle for me. I finished up learning the basics of Python, have a working backend database, and have become more conformable with the frontend side of my platform. I’ve restructured a lot of items and have a vision down for the final architecture.

The end goal is to have everything in a Docker container so that anyone, anywhere can deploy; I want to aim for a ‘push-button-receive-data’ style of deployment. Let’s keep the IT wrangling to a minimum.
Currently the frontend that I have is build on Flask+Jinja2. As I have been developing the proof of concept out, I’ve found some limitations. James, who wrote the original trading program with me, has been pushing me towards AngularJS as the presentation framework.
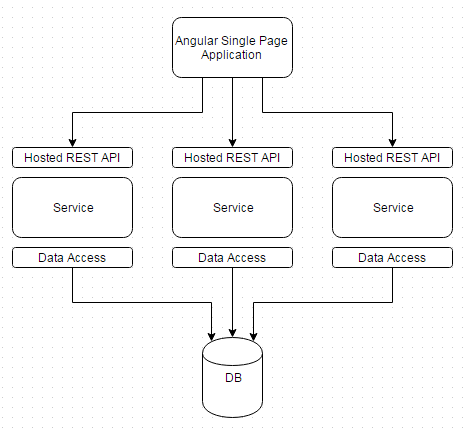
Luckily I’ve kept to the original design principal of keeping every process that needs to communicate as an isolated component. With this design, any component can be replaced or moved and it is transparent to any other layer or neighboring service. Service ‘A’ could can be replaced with no impact to the front or backend, or the backend could be replaced with no impact to the services, and so on.
Laundry List of Improvements and Highlights
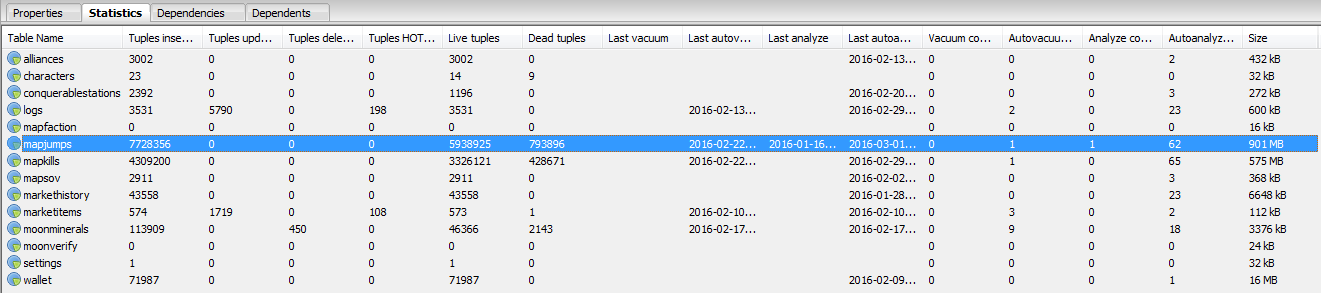
1. We’ve Got Data
2. Improved Database Inserts
I rewrote the insert statements to use primary key constraints to perform error checking rather than selecting if the row exists and then inserting. PostgreSQL does have an UPSERT statement that I would like to utilize to gain even further insert speed, but that will have to come when I update my PostgreSQL version to 9.5+.
Before: [kills] insert 3128 @ 49.85 rec/sec
After: [kills] insert 2948 @ 94.84 rec/sec
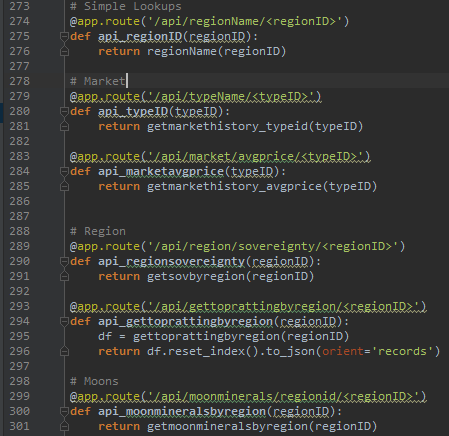
3. RESTful API
Any presentation item that needs data receives it over an JSON API.

4. Multithreading Flask
app.run(host='0.0.0.0', port=80, debug=True, threaded=True)

5. Using pgAdmin for Faster Query Generation

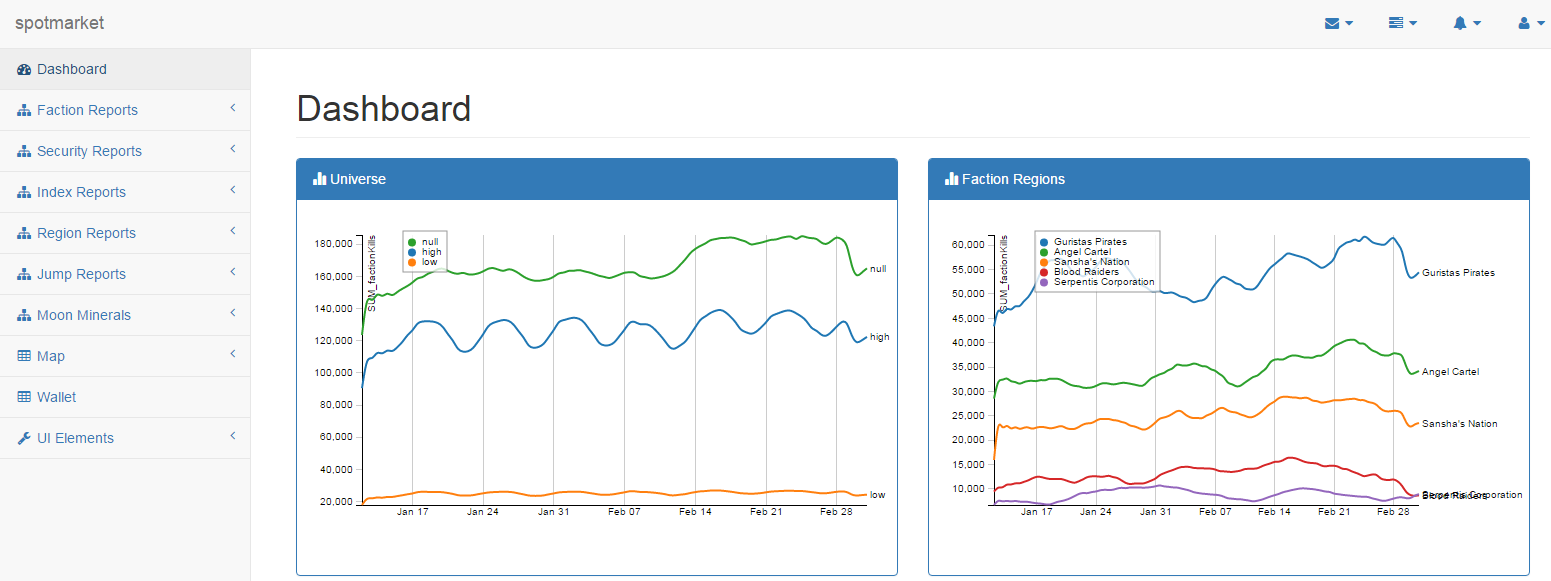
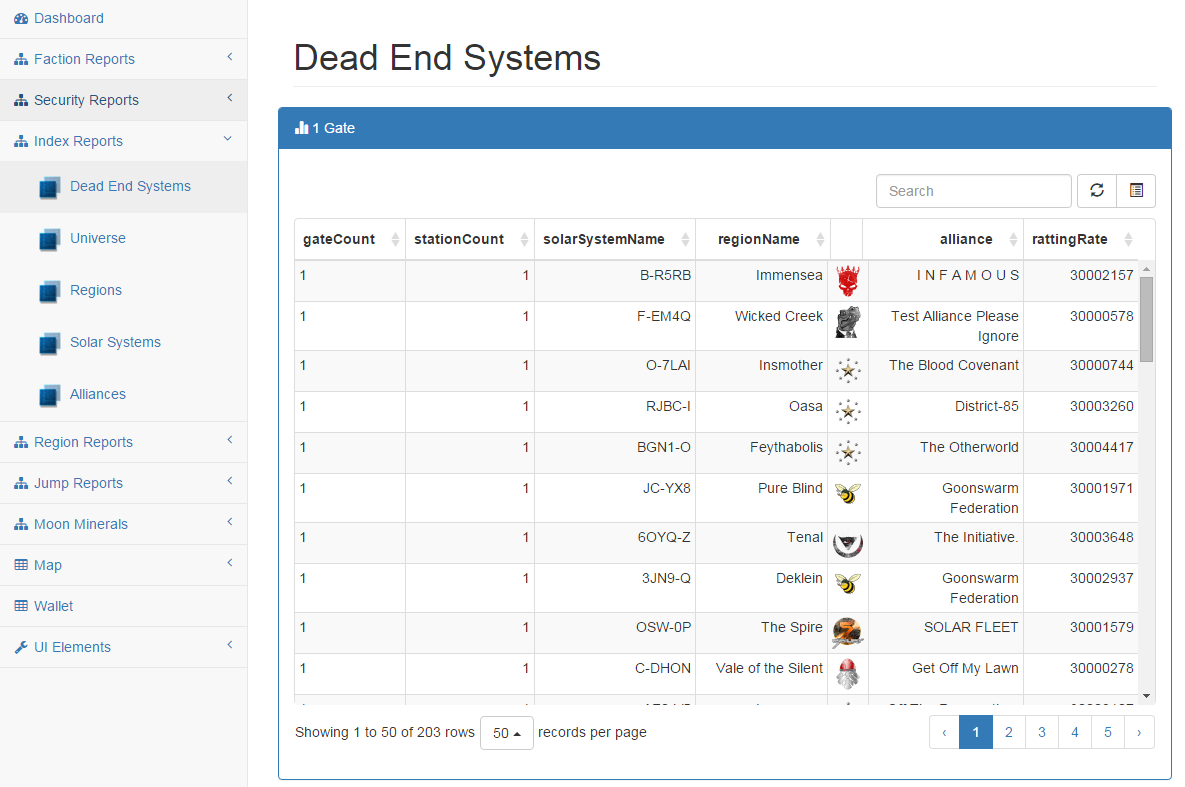
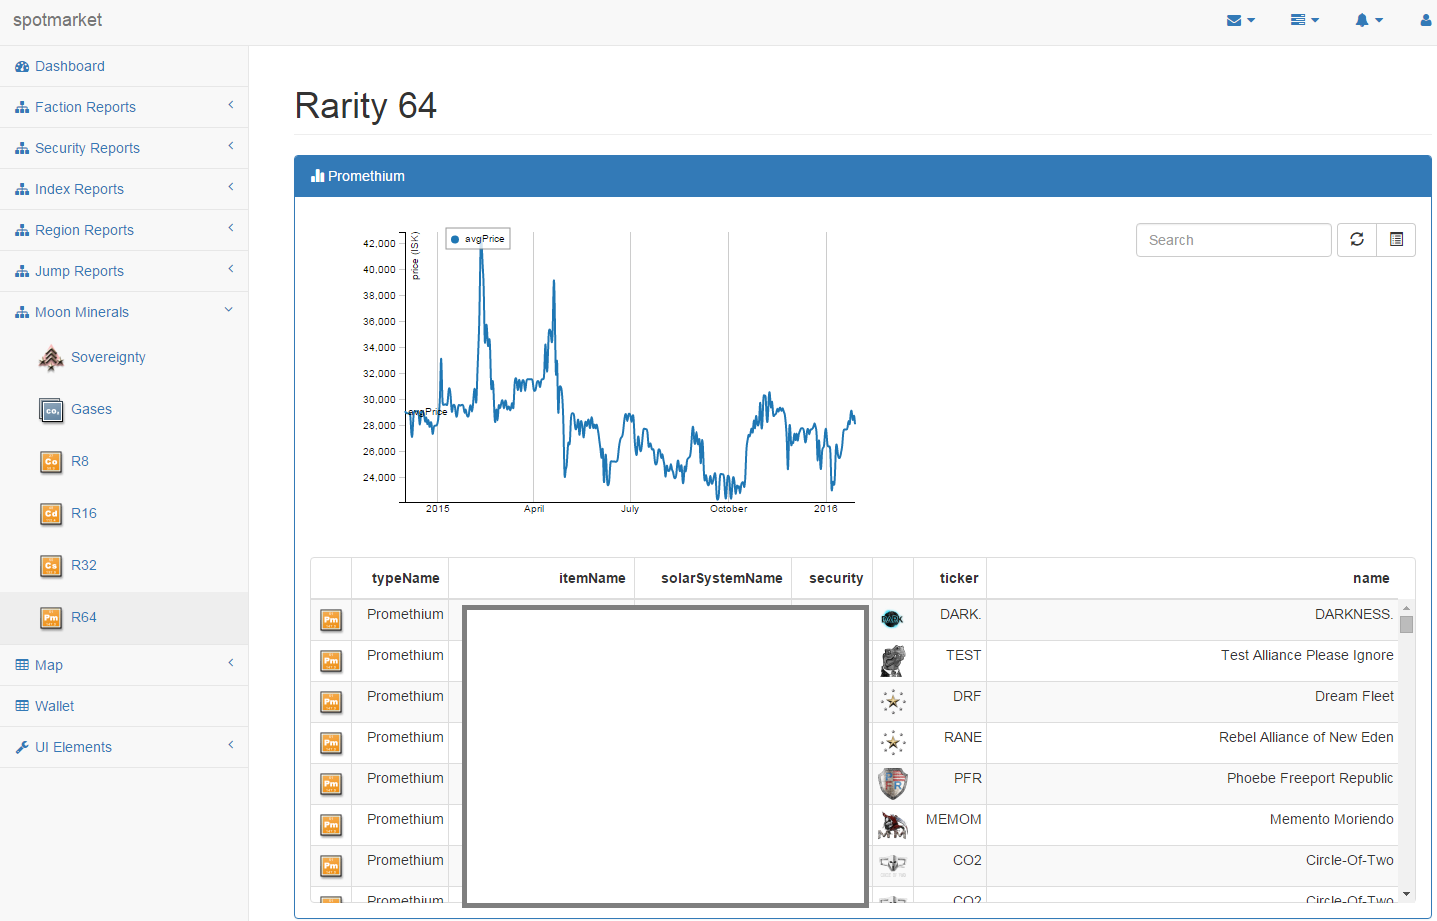
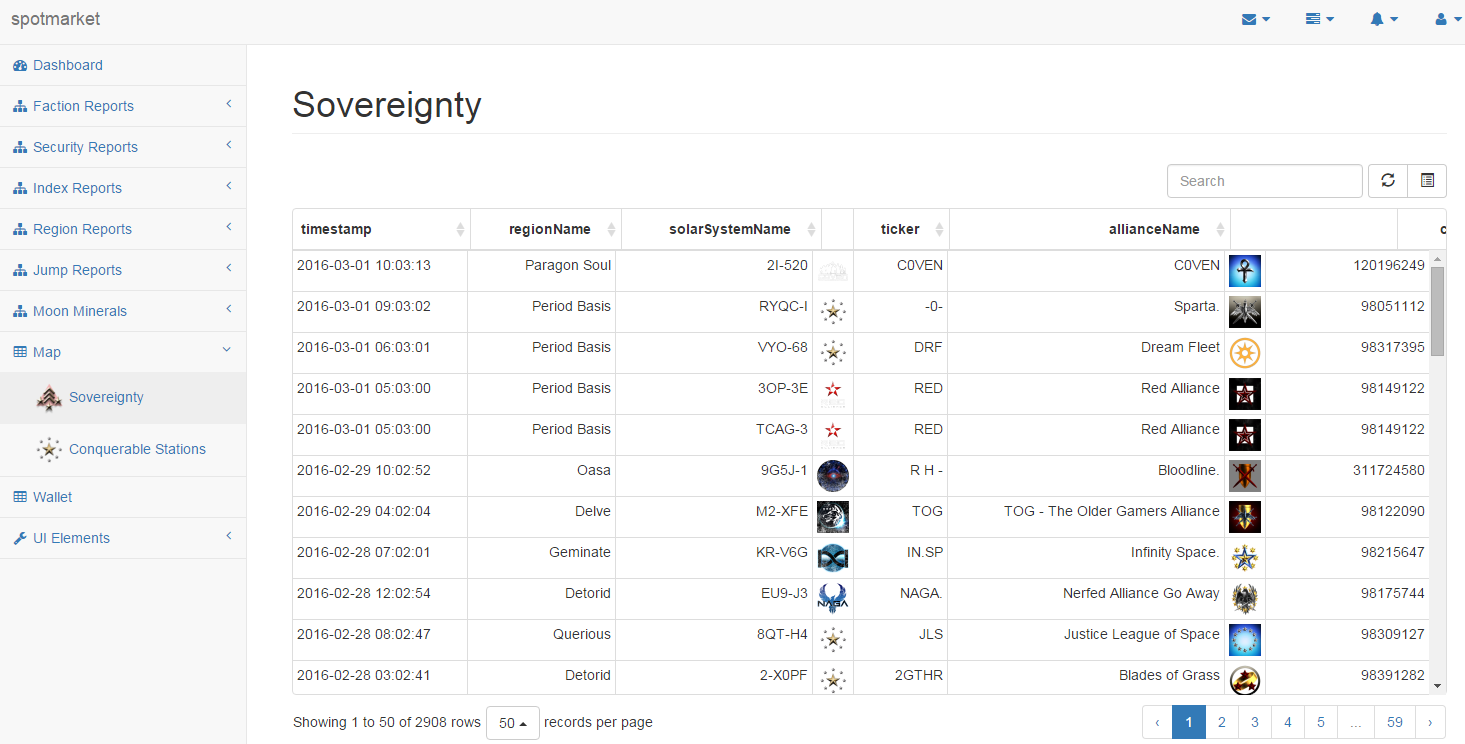
6. Current State
There is a lot of polishing needed, but a lot of the ‘bricks’ as I call them have been put in place. Learning the basics of D3.js, how to return JSON from Pandas manipulated PostgreSQL data, and bootstrap-table for modern table UI all have been on a punch list to learn to get to this state.


What’s Next?
- Bring on a partner that can help guide the frontend.
- Deciding if Flask+Jinja2 is really the right frontend platform for this project (and me).
- Migrating graphing to use height+length percentages rather than finite pixel amounts as the Bootstrap style supports many different formats. Currently the charts look horrible on any tablet or mobile device.
- Parameterize charts and graphs.
- Write consumer for CREST market prices.
- Write consumer for zKillboard/CREST killmails.
- Develop a proof of concept report for a Region that takes only the regionID as an input so that I learn how to build reporting for any region or Solar System.
- Leveraging the power of Pandas by spending more time on the thinking problems: developing Indexes, finding trends, and learning about covariance.
- Reach a good polish so I can publish a 0.3 release.
- Learning how to create a Docker image.
Latest updates can be found on the 0.3-dev branch.
Opening Day Skill Trading Jump Activity
Posted: 2016-02-11 Filed under: eveonline, market | Tags: skill extractor, skill injector Leave a commentWith the February 2016 Release 1.0 came the addition of skill trading. Since I’m recording jump activity, I thought it would be neat to see how busy the major trade hubs were on the opening day of the Brainmeat Market(TM) (almost registered tradmark @Lockefox) bazaar.
Data taken from the /map/Jumps.xml.aspx API.
Another item to note is that we also saw an increase in the concurrent player count in Jita to 5,000.


Jita to Amarr Route


spotmarket – pivot and resample
Posted: 2016-01-29 Filed under: market, python, spotmarket | Tags: blood raiders, cloud ring, delve, fade, fountain, outer ring, period basis, querious, serpentis, syndicate Leave a commentOverview
I published v0.2, which includes a bunch of hacked together proof of concept code. This week I dove into the pandas library, focusing on the data manipulation tools that are inherit to pandas. This post covers some of the highlights and demonstrates the initial charting that I’ve been producing.
More to come on what I plan to do with the data; for now those details have to be a trade secret.
Data Frame
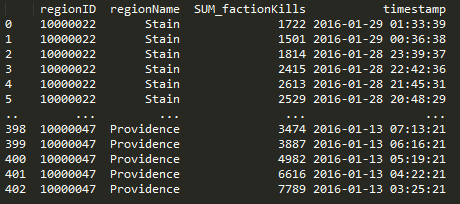
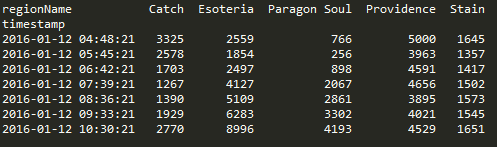
The crux of pandas is the dataframe and this week I discoverd that you can load your query results right into a dataframe and not have to write a parser. Notice in the below code that I run the query and place the results into a dataframe with a ‘fetchall()’. This really saves me a lot of headaches when passing around chunks of data and makes it easy to write functions to combine data with overlapping values. Return the dataframe and do more ::work::.
Here’s a query that I use to get NPC kills by region when given a regionID.
def getnpckills_byregion(regionID):
    conn = psycopg2.connect(conn_string)
    cursor = conn.cursor()
    sql = """SELECT
      "mapSolarSystems"."regionID",
      "mapRegions"."regionName",
    SUM(mapkills."factionKills") as SUM_factionKills,
      mapkills."timestamp"
    FROM
      data.mapkills,
      public."mapRegions",
      public."mapSolarSystems"
    WHERE
      "mapRegions"."regionID" = "mapSolarSystems"."regionID" AND
      "mapSolarSystems"."solarSystemID" = mapkills."solarSystemID" AND
      public."mapSolarSystems"."regionID" = %s
    GROUP BY mapkills."timestamp", public."mapSolarSystems"."regionID", "mapRegions"."regionName"
    ORDER BY timestamp DESC
    """
    data = (regionID, )
    cursor.execute(sql, data)
    df = pd.DataFrame(cursor.fetchall(),columns=['regionID', 'regionName', 'SUM_factionKills', 'timestamp'])
    cursor.close()
    return df
Pivot
Doing a pivot in pandas is amazingly elegant and you can perform the operation in one statement.
df.pivot(index='timestamp', columns='regionName', values='SUM_factionKills')
Resample
Another powerful tool in the library are the resampling options. I’m still trying adjusting the parameters to find a balance on data granularity.
The below graphs show NPC kills over all regions over time. One graph has no resampling while the other has values that I feel display a daily value, normalizing the peaks and valleys that occur due to server downtime and differing activity rates due to timezone.
conversion = "12H"
v_window = 8
v_minperiods = 1
pd.rolling_mean(df.resample(conversion, fill_method='bfill'), window=v_window, min_periods=v_minperiods)


Results
Ratting activity in Blood Raiders regions:


Ratting activity in Serpentis regions:


More to come. Find me on #k162space on tweetfleet.slack.com.
spotmarket Project Announcement
Posted: 2015-12-31 Filed under: market, spotmarket Leave a commentIf you have followed the musings of this blog over the past two or three years, you are probably familiar with our Wallet Manger project. Growing out of the limitations of comparing market price exports from the client in Excel, James and I started a homebrew project in a framework called Yii to help us manage our market trades and have more visibility on item performance.
It wasn’t polished, lacked security features, had many missing features, and was more of a proof of concept than a properly managed project; it was a path to flex our IT muscles and learn XML, JSON, PHP, MySQL, database Indexes, and version control.
2015 ended on a high note for me as I landed a position at a quantitative trading firm, with the challenges of coding the Wallet Manager and stories about working with Eve 3rd party developers broached during the interview process.
2016 will be a year of rekindled interest in working with Eve data again for both me and my partner James. Want to refresh our homebrew project using an updated set of tools and change the focus.
There are many projects out there that record historical data from the API and present it to you. We want to go a step further and build an analysis platform that can incorporate data from the API and use it to create relationships to fuel predictions. We’re currently picking our tools and formulating requirements so be sure to watch for updates as we develop our platform.
If you want to join the discussion, head on over to #k162space on tweetfleet.slack.com.
Gecko Speculation Results
Posted: 2015-12-15 Filed under: market | Tags: gecko 1 CommentAfter months of waiting and watching, I finally cashed out on the pile of Gecko heavy drones.

I bought 326 at an average price of 50.05 M ISK. I cashed out after 219 days for a net profit of 8.83 B. The reason that I exited the market on this item was because of how the daily profit per days invested chart was trending. I missed the bubble on the market and had to settle for a average of 40.51 M ISK/day invested. The time to sell would have been before Eve Vegas.

Producing capitals still averaged out to more money on average at 50.27 M ISK/day; details on that project can be found here.
