
spotmarket – pivot and resample
Posted: 2016-01-29 Filed under: market, python, spotmarket | Tags: blood raiders, cloud ring, delve, fade, fountain, outer ring, period basis, querious, serpentis, syndicate Leave a commentOverview
I published v0.2, which includes a bunch of hacked together proof of concept code. This week I dove into the pandas library, focusing on the data manipulation tools that are inherit to pandas. This post covers some of the highlights and demonstrates the initial charting that I’ve been producing.
More to come on what I plan to do with the data; for now those details have to be a trade secret.
Data Frame
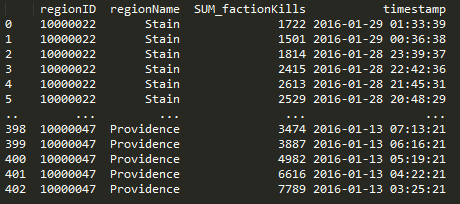
The crux of pandas is the dataframe and this week I discoverd that you can load your query results right into a dataframe and not have to write a parser. Notice in the below code that I run the query and place the results into a dataframe with a ‘fetchall()’. This really saves me a lot of headaches when passing around chunks of data and makes it easy to write functions to combine data with overlapping values. Return the dataframe and do more ::work::.
Here’s a query that I use to get NPC kills by region when given a regionID.
def getnpckills_byregion(regionID):
    conn = psycopg2.connect(conn_string)
    cursor = conn.cursor()
    sql = """SELECT
      "mapSolarSystems"."regionID",
      "mapRegions"."regionName",
    SUM(mapkills."factionKills") as SUM_factionKills,
      mapkills."timestamp"
    FROM
      data.mapkills,
      public."mapRegions",
      public."mapSolarSystems"
    WHERE
      "mapRegions"."regionID" = "mapSolarSystems"."regionID" AND
      "mapSolarSystems"."solarSystemID" = mapkills."solarSystemID" AND
      public."mapSolarSystems"."regionID" = %s
    GROUP BY mapkills."timestamp", public."mapSolarSystems"."regionID", "mapRegions"."regionName"
    ORDER BY timestamp DESC
    """
    data = (regionID, )
    cursor.execute(sql, data)
    df = pd.DataFrame(cursor.fetchall(),columns=['regionID', 'regionName', 'SUM_factionKills', 'timestamp'])
    cursor.close()
    return df
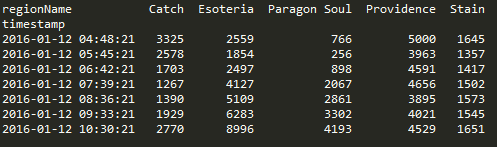
Pivot
Doing a pivot in pandas is amazingly elegant and you can perform the operation in one statement.
df.pivot(index='timestamp', columns='regionName', values='SUM_factionKills')
Resample
Another powerful tool in the library are the resampling options. I’m still trying adjusting the parameters to find a balance on data granularity.
The below graphs show NPC kills over all regions over time. One graph has no resampling while the other has values that I feel display a daily value, normalizing the peaks and valleys that occur due to server downtime and differing activity rates due to timezone.
conversion = "12H"
v_window = 8
v_minperiods = 1
pd.rolling_mean(df.resample(conversion, fill_method='bfill'), window=v_window, min_periods=v_minperiods)


Results
Ratting activity in Blood Raiders regions:


Ratting activity in Serpentis regions:


More to come. Find me on #k162space on tweetfleet.slack.com.
Delve Financial Warfare
Posted: 2012-06-29 Filed under: eveonline, market, nullsec | Tags: delve, delve2012, goons, period basis, querious, test 5 CommentsAfter I get home from work and eat dinner, I usually only have around an hour a night that I can dedicate to Eve. This open hour doesn’t give me a lot of time to participate in any of the large TEST fleets so I am going to help out the war in a different way. In addition to the spaceship war, I am going to launch a fiancial war on the current residents of Delve, Querious, and Period Basis.
One of my trading alts is going to fly around and mess up the markets. I’m going to polish off his skills so I can have region-wide abilities to buy, sell, and modify prices.

Here are some rough goals:
- Drive up the prices of doctrine items
- Buy out stocks of ships, ammo, guns, and fuel
- Undercut to drive out logistical people that stock markets
I’m going to start with 31B in funds and possibly scale up to 50B depending on how successful this becomes.

I have never done any type of mass manipulation on this scale so there is a high risk that it will not be successful. I will try to document any significant advancements in my campaign here so stay tuned.
#delve2012
