
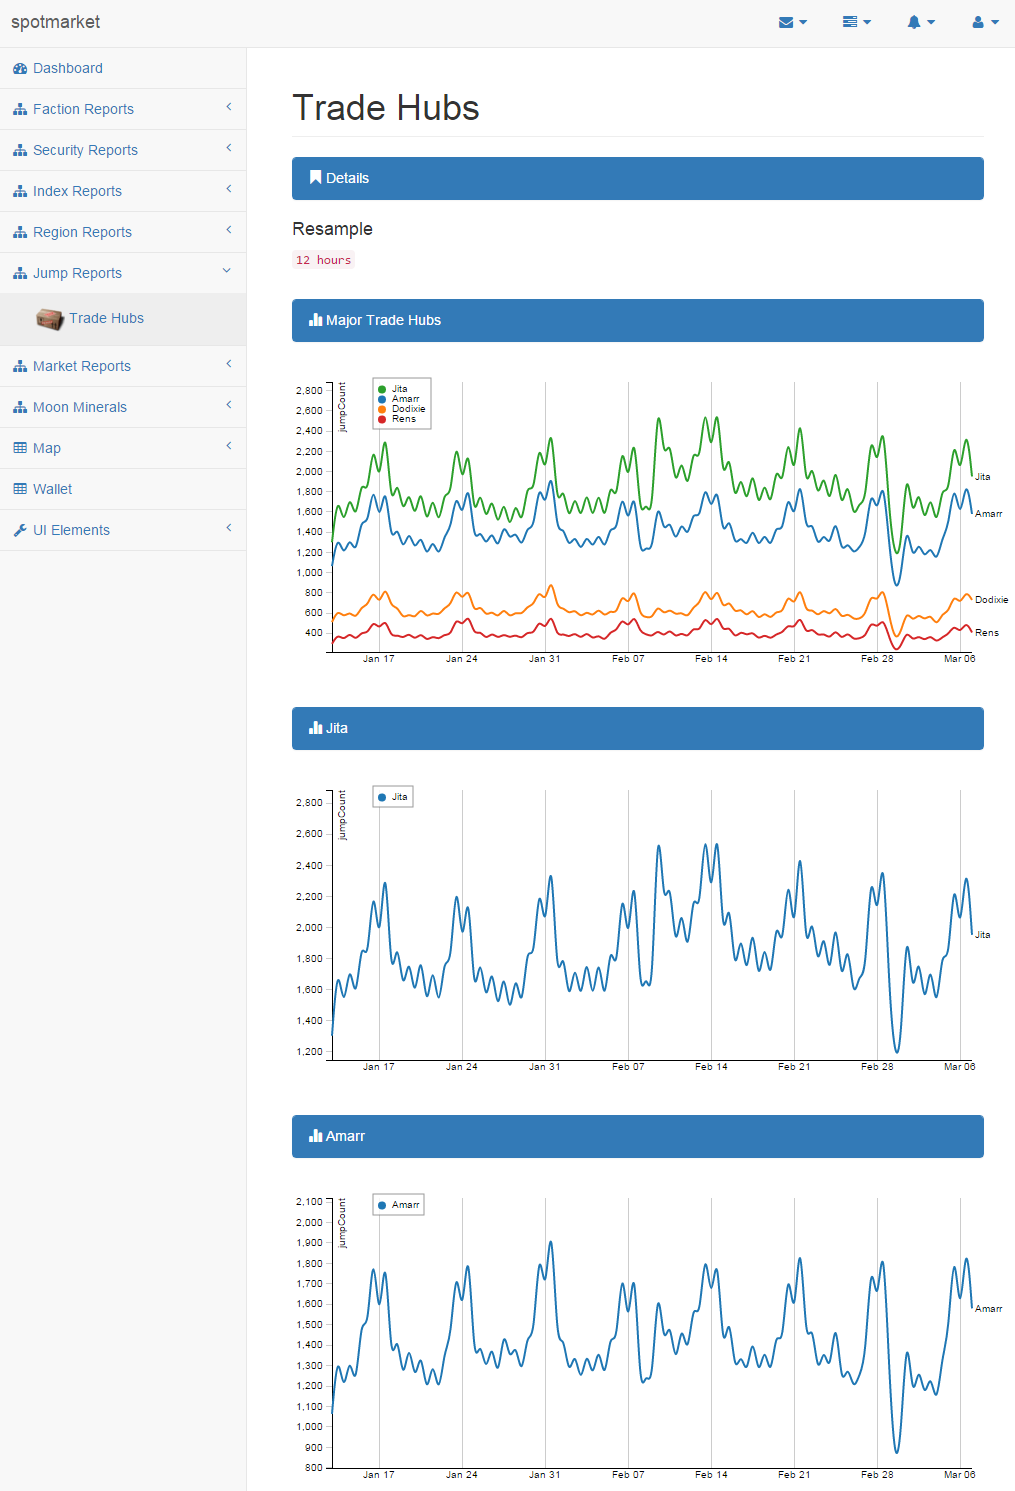
spotmarket Graph Sample
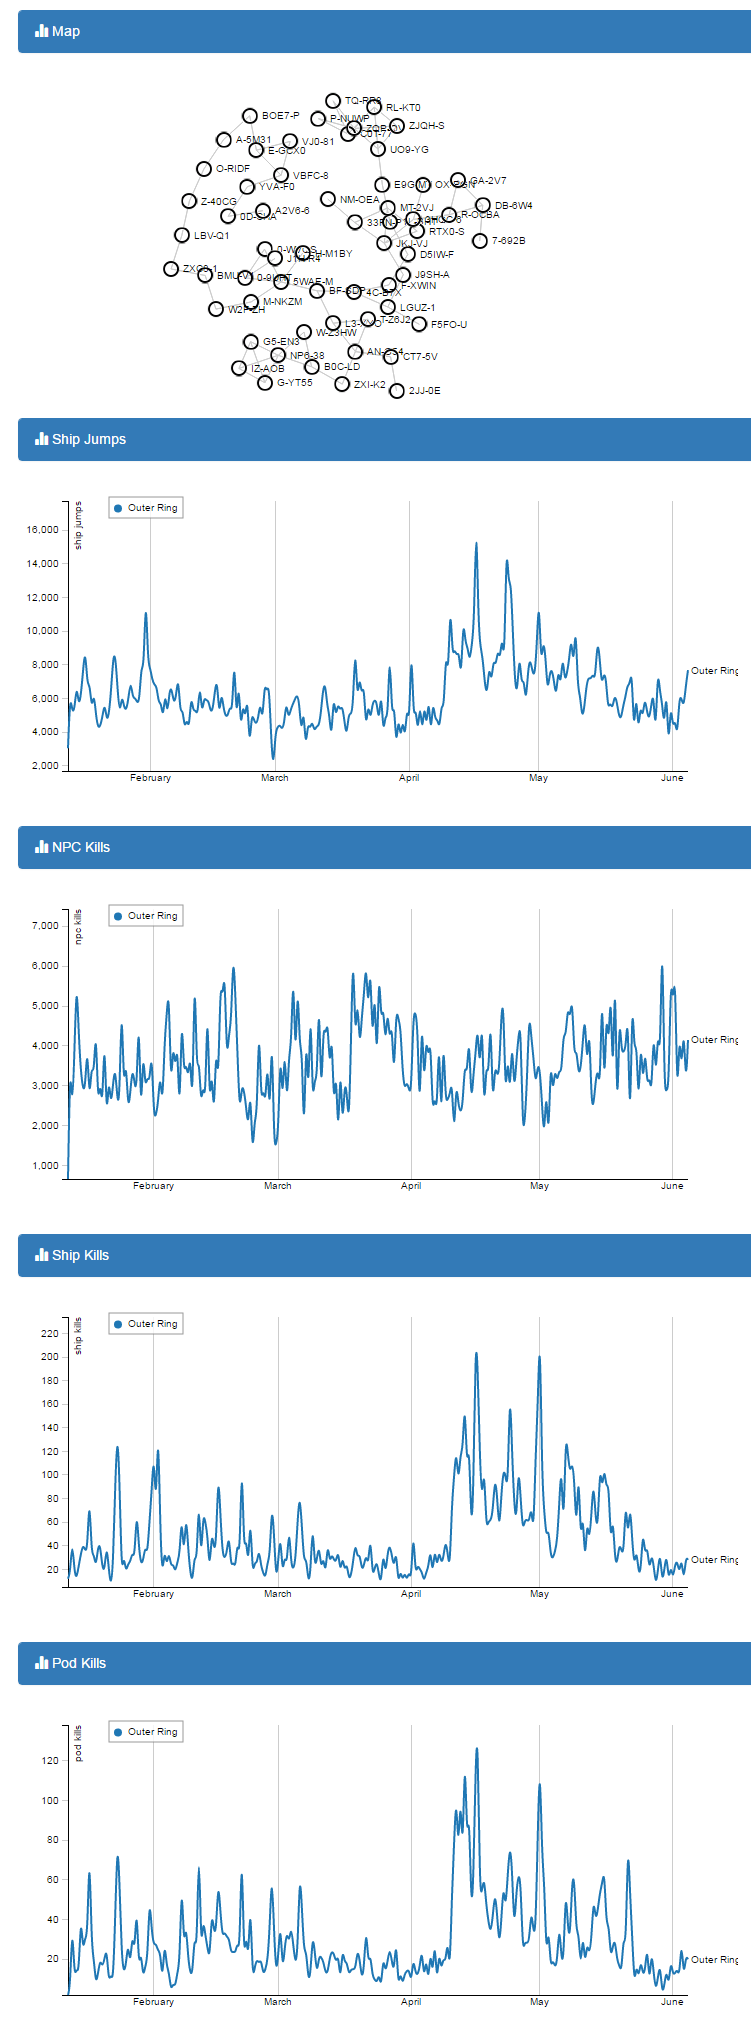
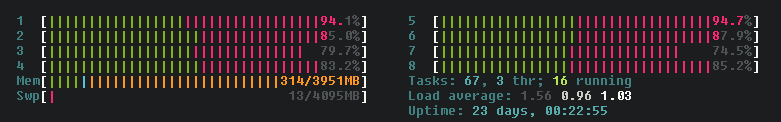
Posted: 2016-06-07 Filed under: nullsec, pvp, python, spotmarket | Tags: amarr, branch, deklein, dodixie, fade, guristas, jita, pure blind, rens, tenal, the forge, tribute, venal Leave a commentWhat’s data without some graphs? Here is a small snip of the graphing that is currently in the spotmarket project.
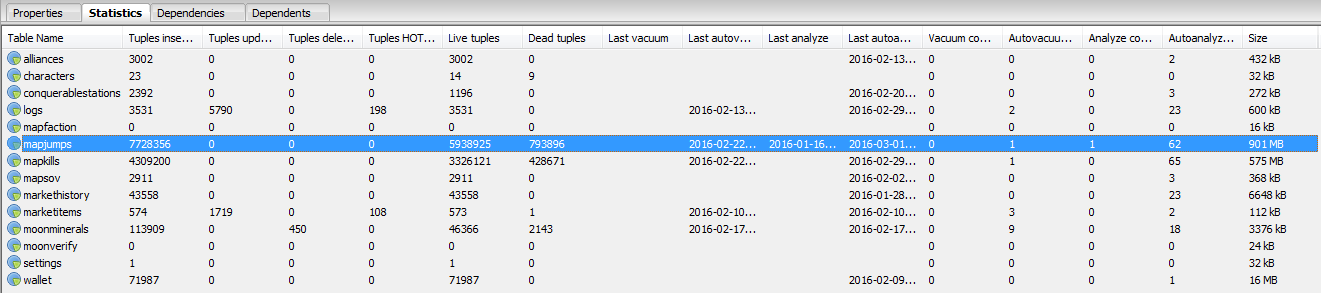
Data
Jumps
2016-01-13 to 2016-06-07
17,802,640 Rows
Kill
2016-01-13 to 2016-06-07
9,819,421 Rows
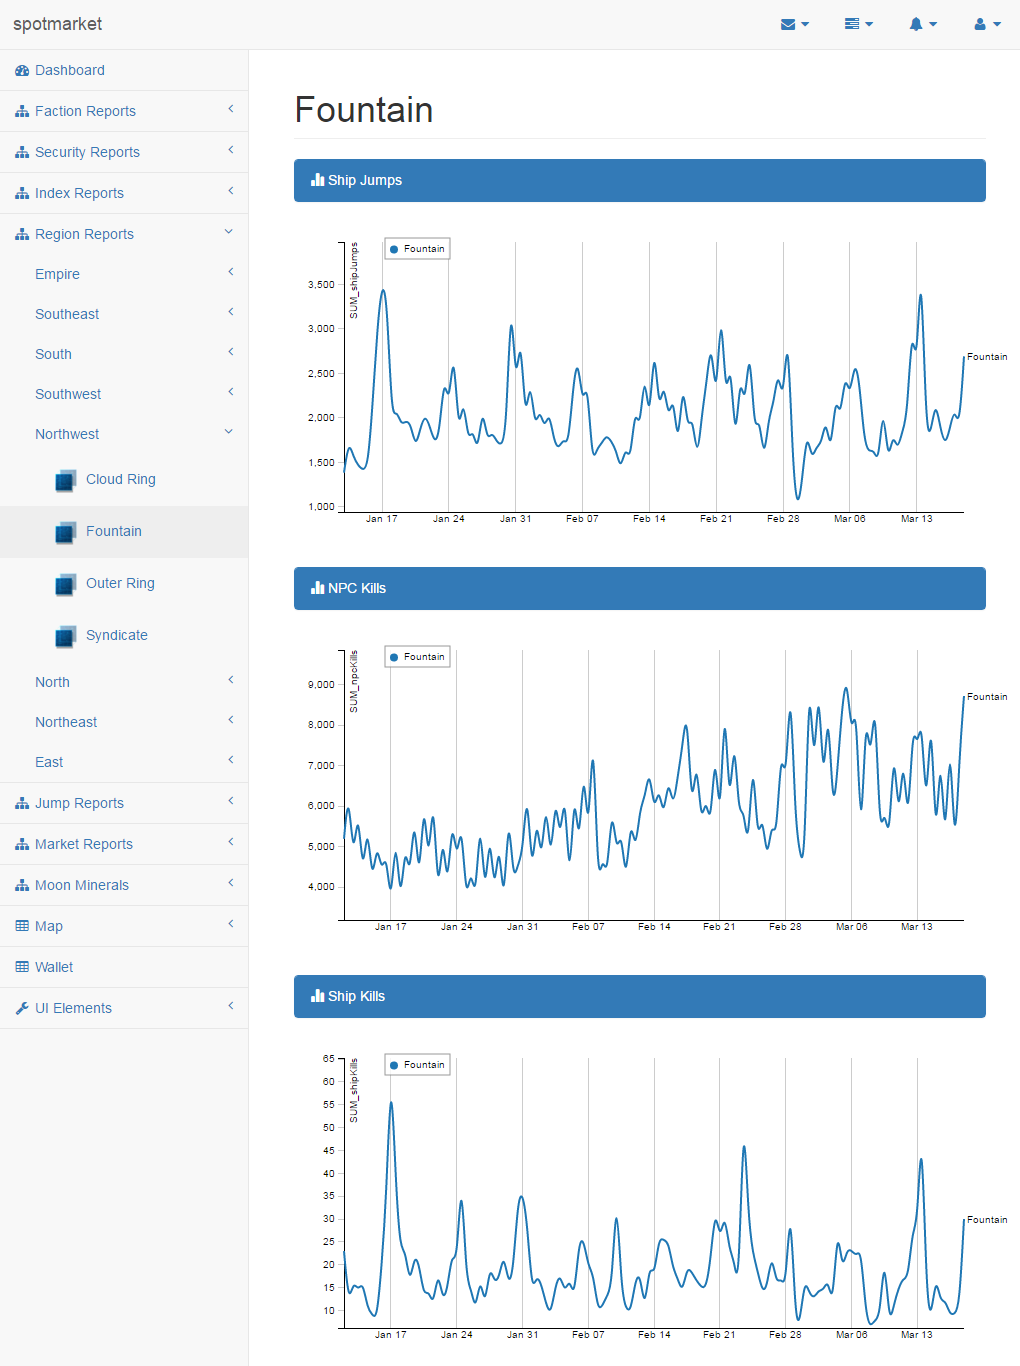
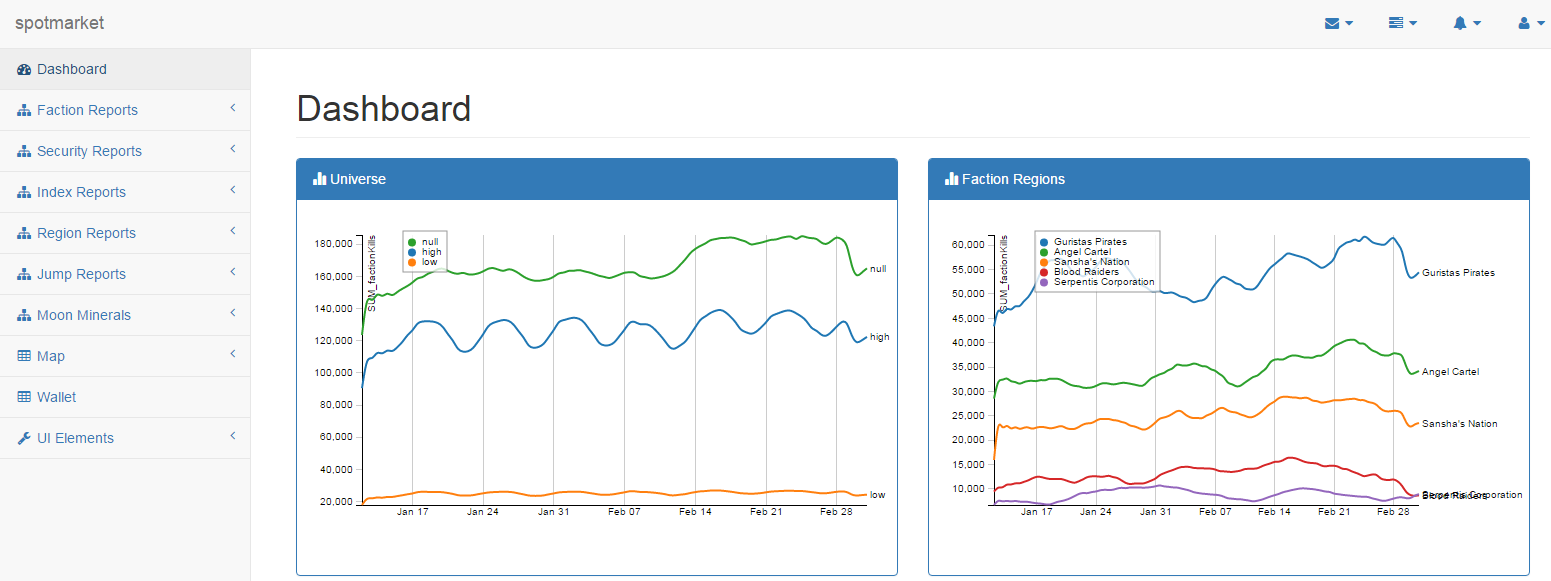
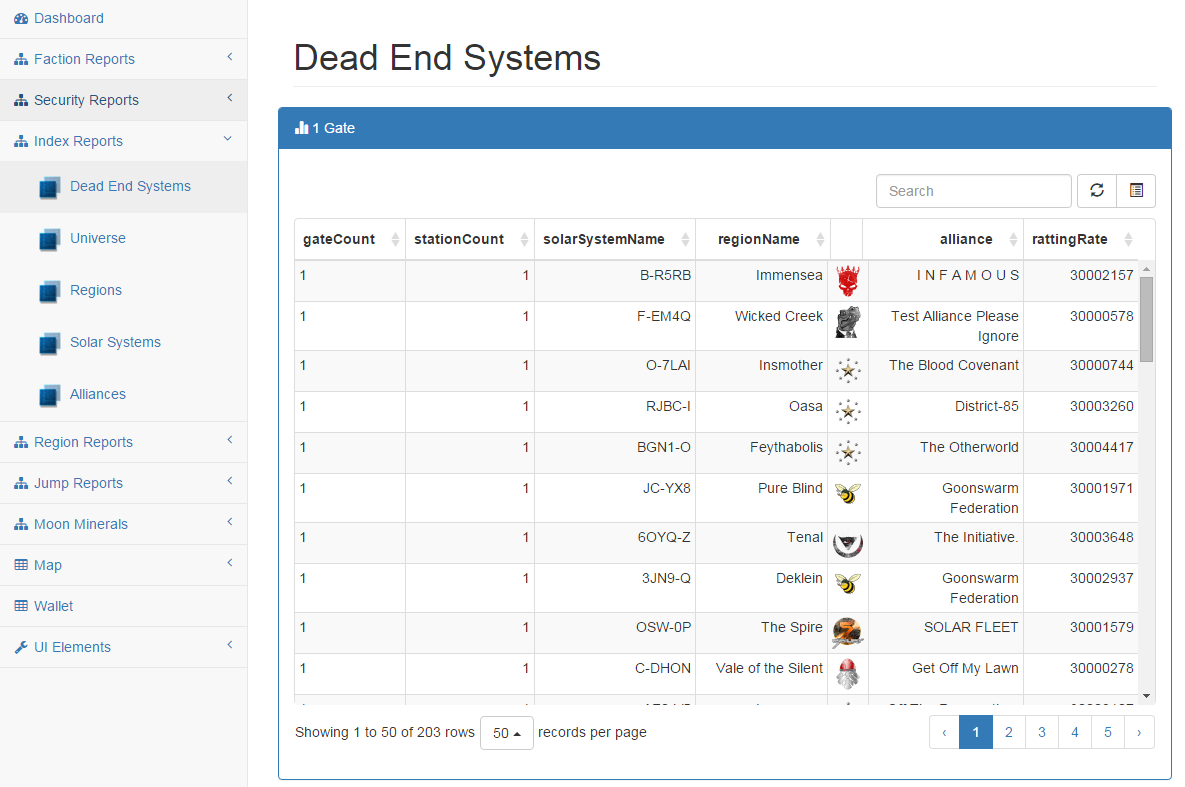
Graphs
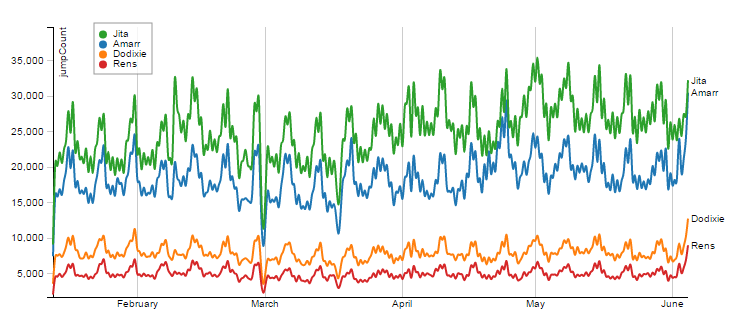
Jumps in Trade Hubs
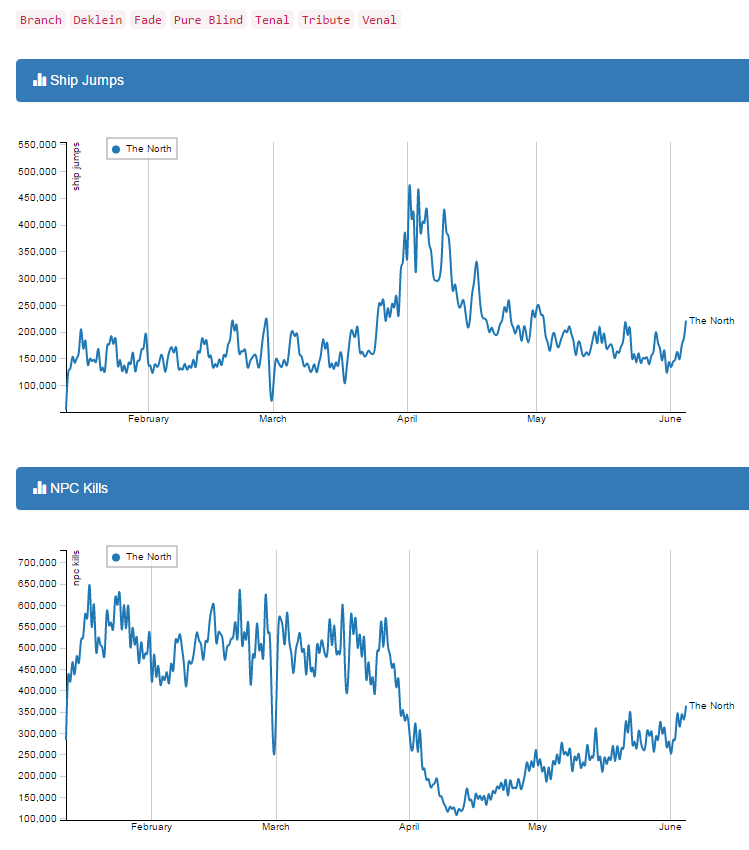
Jumps and NPC Activity in The Northern Regions
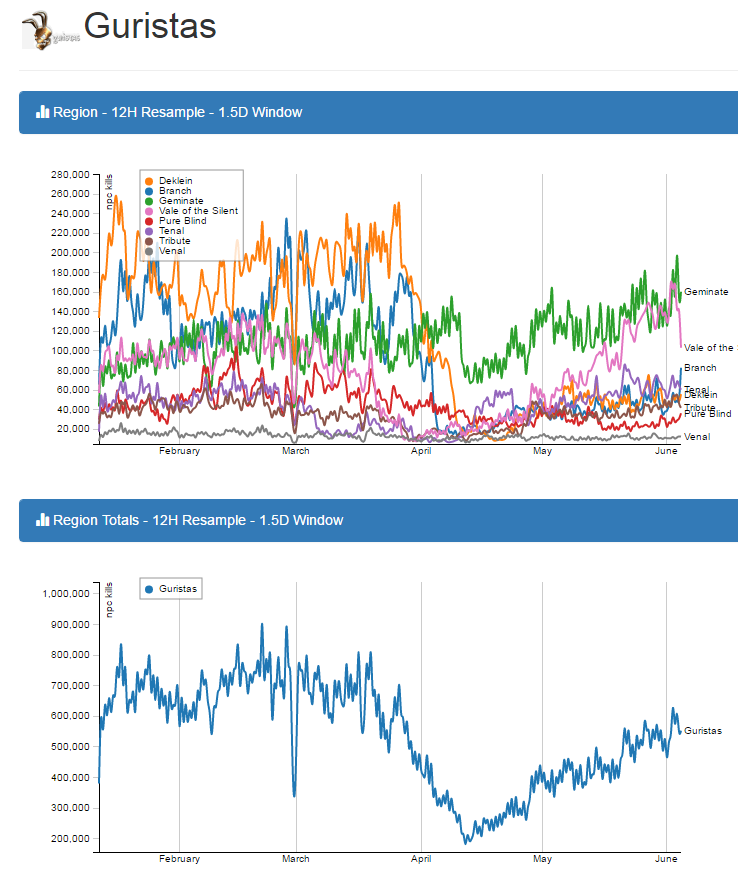
Gurista Ratting Rates
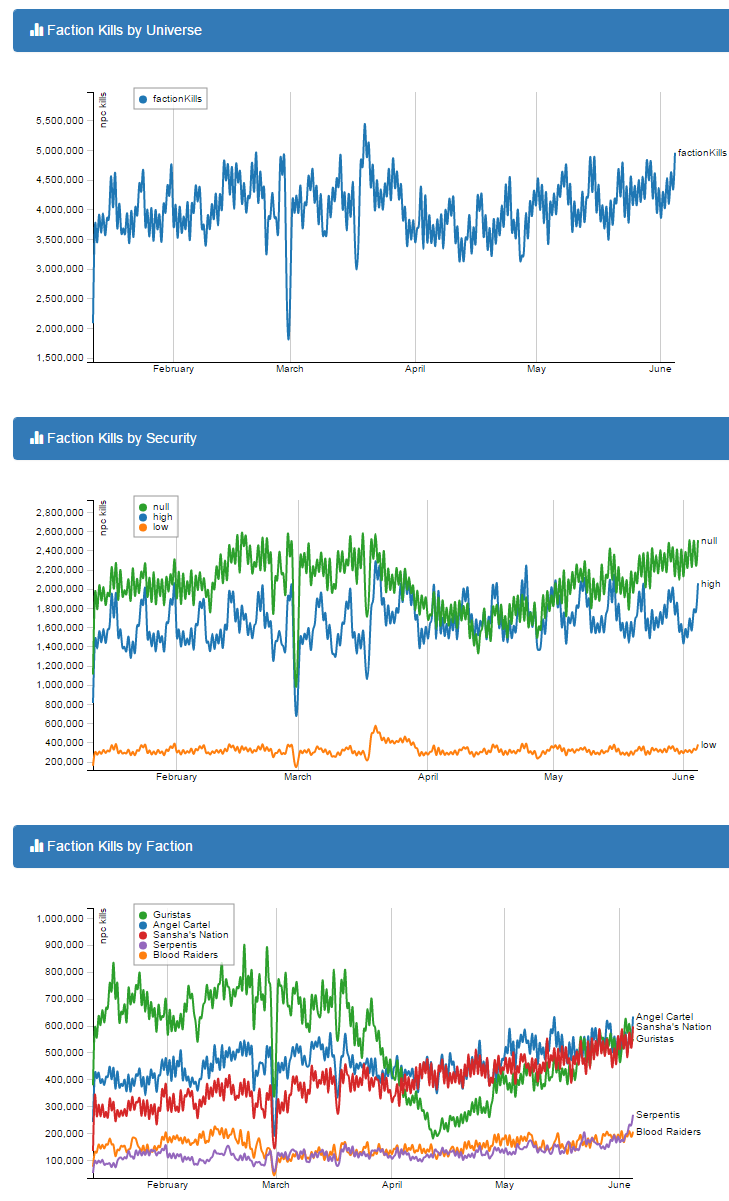
NPC Universe Overview
Outer Ring
First pass at a map using D3.js inspired by HelicityBoson at http://www.machine9.net/?p=1111.
spotmarket – 0.6
Posted: 2016-06-07 Filed under: python, spotmarket 1 CommentProject Update
Basically…

via @ThePracticalDev
Work on the spotmarket project has staled as I have a major work deliverable coming up at the end of the month. I’ve figured out some things, have found pain points that I need to optimize, and the wonderful nature of feature creep keeps adding more and more to the growing list of items that I need to work on so I never feel like I’ve made any progress.
Data Errors
After the XML API moved to the new London datacenter, I started to notice a small uptick in ratting and kill rates. I didn’t bother to investigate and kept on happily coding. As I was reworking the schema and moving data to different tables, I performed a check against the dataset and discovered duplicate entries that were a second off occurring 3-4x a day.
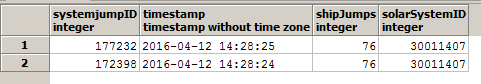
I’m using the cachedUntil value of the API as my timestamp with timestamp and solarSystemID as my primary key. I have a process that fetches the data multiple times an hour and performs an import. I’ve been told by multiple people not to not use cachedUntil as the timestamp, but this is what I’ve coded the first time around.
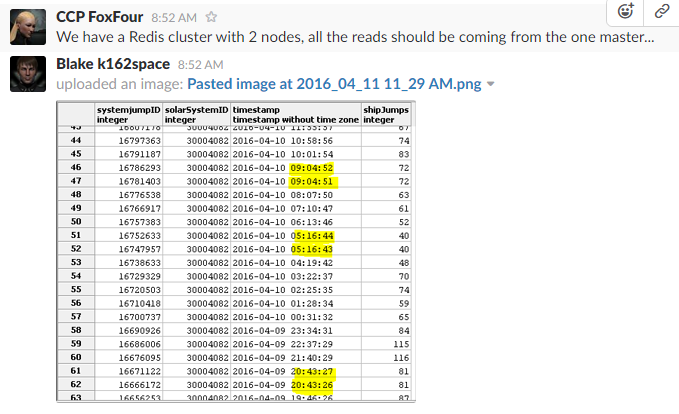
I reached out to CCP FoxFour and it seems that I shouldn’t be seeing timestamps off by 1 second.
I have a temporary fix for this, which is manually running a python process to iterate over all solarSystemIDs and correct duplicate data via a JOIN query. The real fix will mean reworking the consumer script.
Parallel Tasks
The biggest advancement in my project came this month when I learned how to use Python concurrent.futures. Recording market prices at 0.8 records/second isn’t exactly the best way to scan 8,300 items across multiple regions.
Python concurrent.futures to lets you asynchronously execute callables. This means that I can create a worker pool and submit jobs to it. As each worker finishes, it will get a new job.
Here are 8 requests in my market scanner:
[Domain][typeID:19][Spodumain]
[Domain][typeID:35][Pyerite]
[Domain][typeID:34][Tritanium]
[Domain][typeID:21][Hedbergite]
[Domain][typeID:22][Arkonor]
[Domain][typeID:18][Plagioclase]
[Domain][typeID:20][Kernite]
[Domain][typeID:36][Mexallon]
What’s so interesting about this? Check out the order — the jobs were submitted in order (typeID 19, 20, etc.) and returned out of order because they finished at different times.
I scaled the import process up to 16 workers (8 cores x 2) and was able to scan 8,300 prices in about 30 minutes.
I have some work to do where I want to change the insert portion to only insert new data. Right now it is throwing the entire response into the database and relying on key constraints to dedupe.
Characters
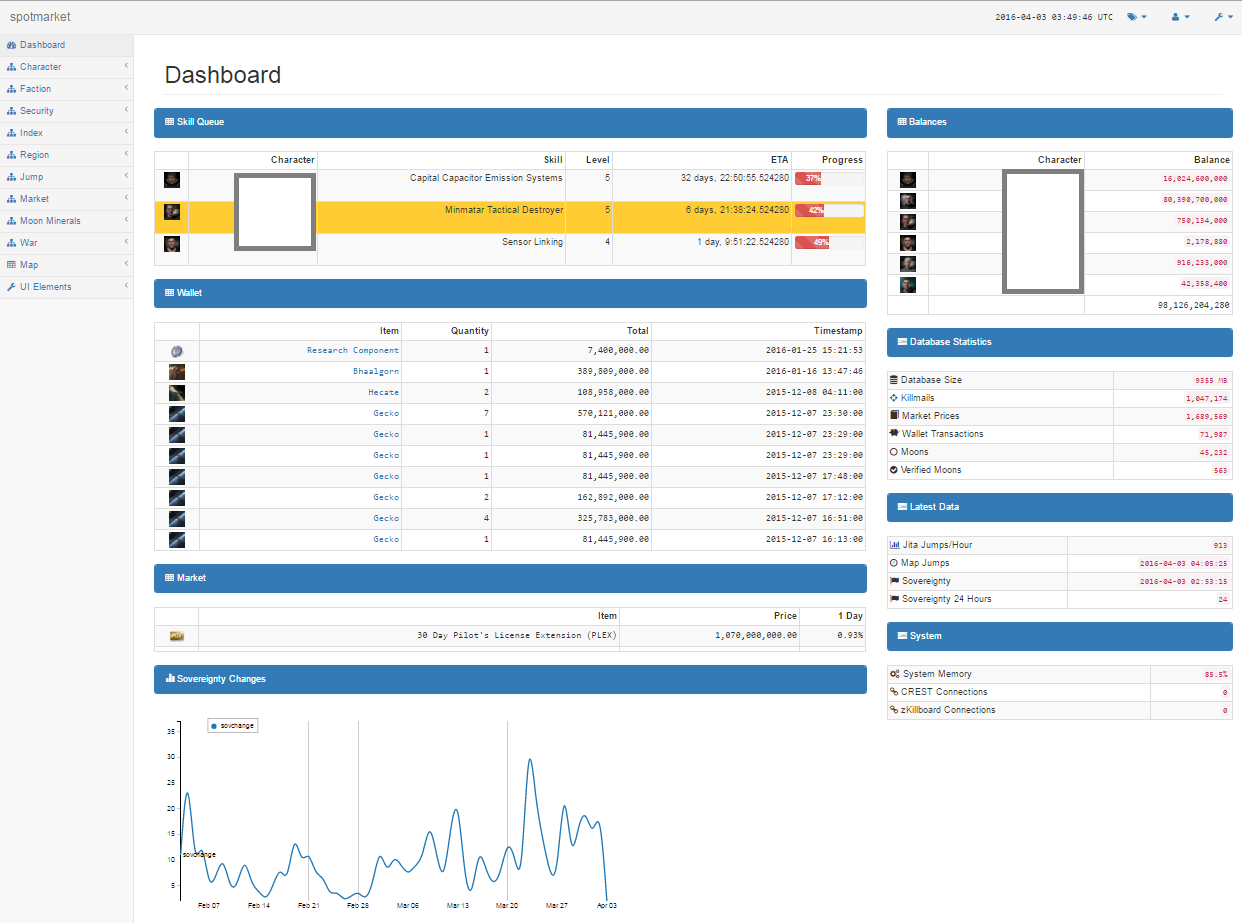
The previous trading platform was good at showing transactions, balances, and item trends so I started to replicate a lot of the features. For a first pass, I wanted to start to integrate Character information so I added API processes for Wallet, Orders, and Blueprints. I’ll finish up with Journal and Assets in the next pass.
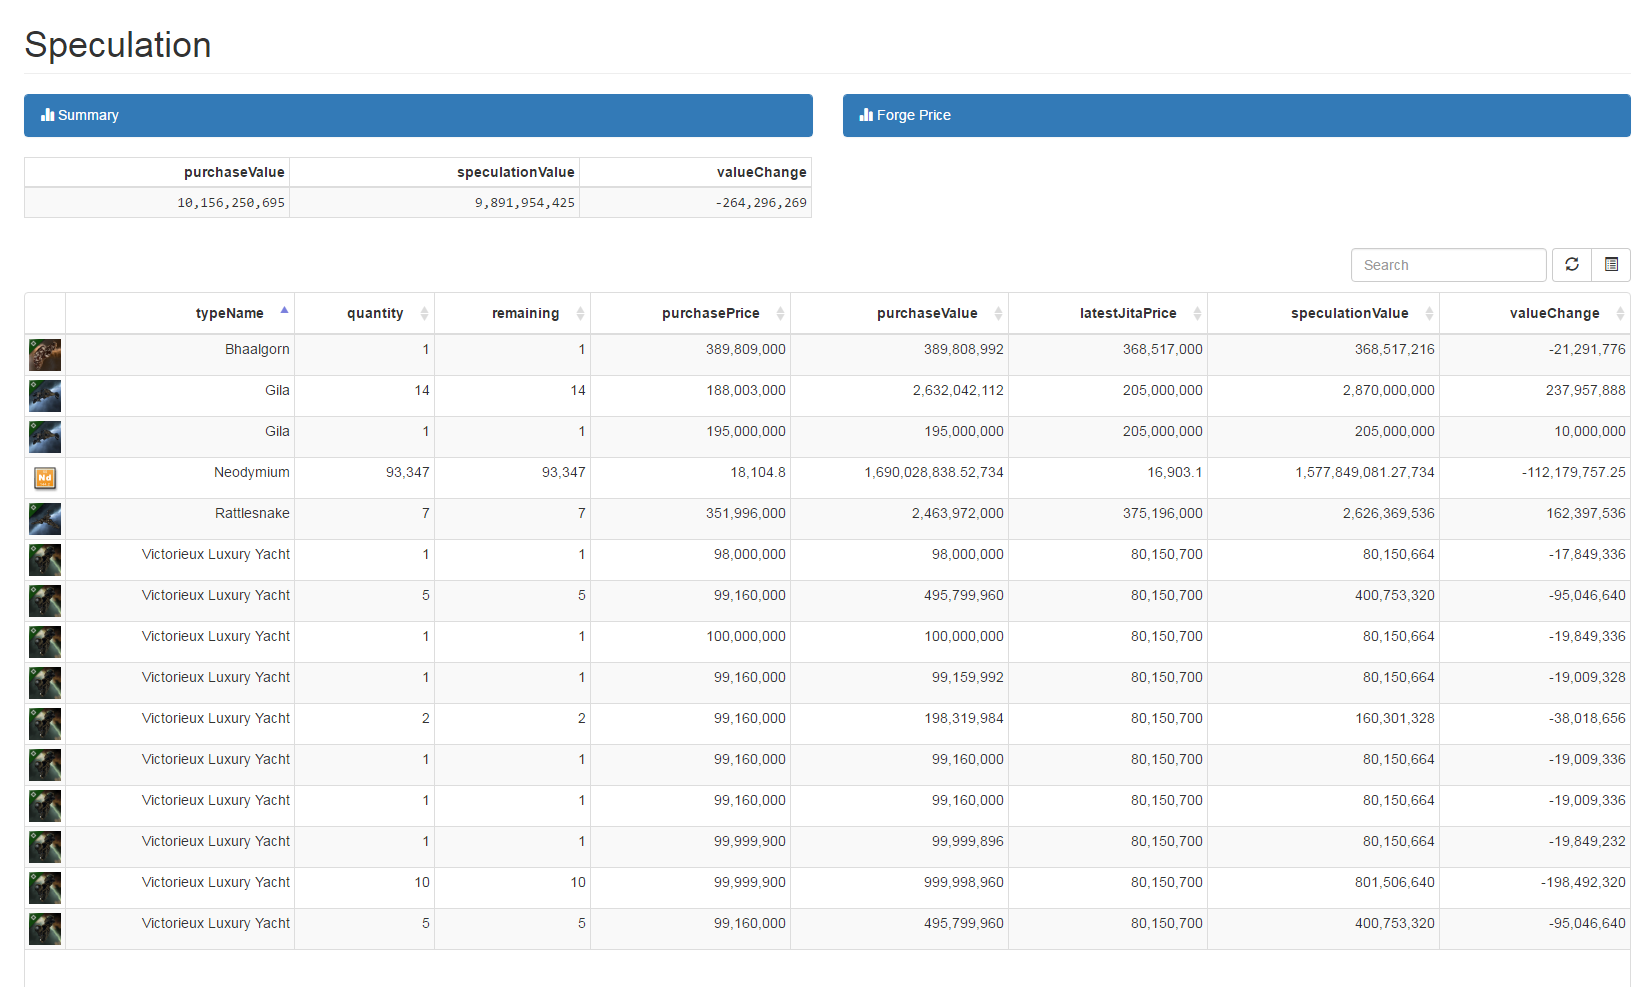
Speculation
I’ve started to put my foot into the speculation market and built up a page to track my investments. Getting items into the table isn’t elegant, you have to throw a transactionID at an API endpoint so it records it from the wallet table into the speculation table.
I don’t have enough jQuery knowledge to create buttons to post to a API endpoint yet. Adding the ability to write back to the database will bring a lot of interaction to the project so it’s high on the list.
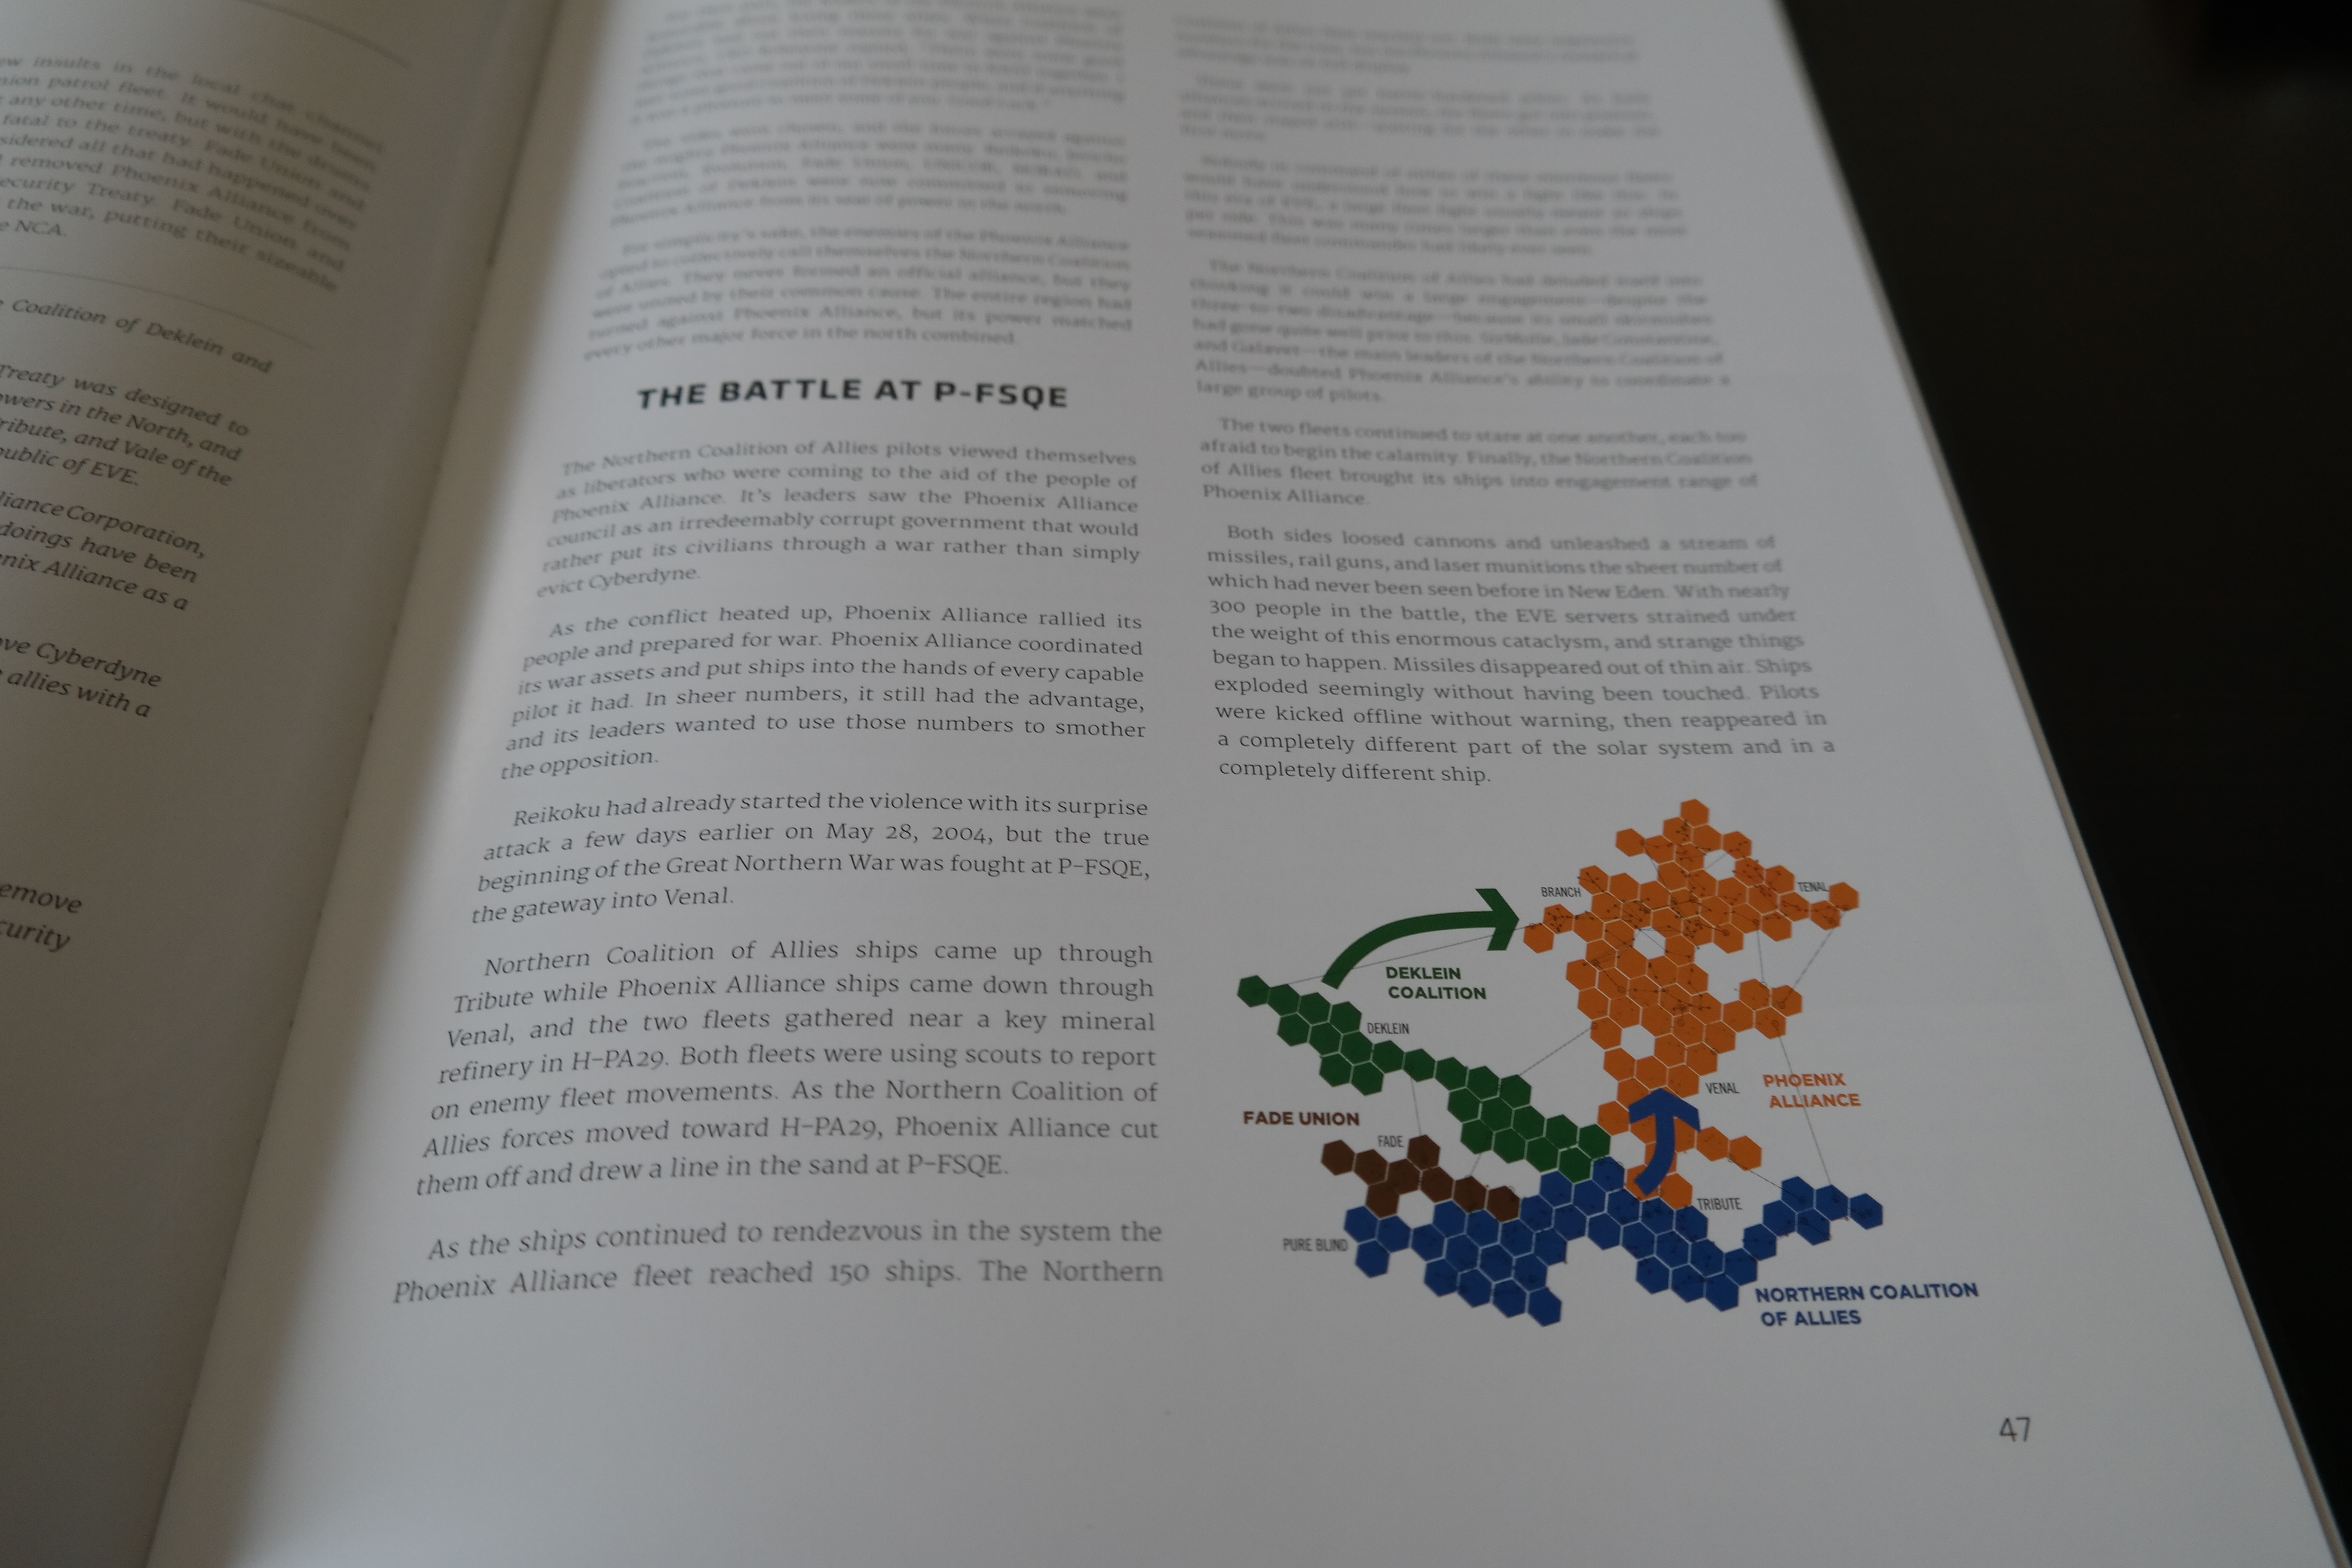
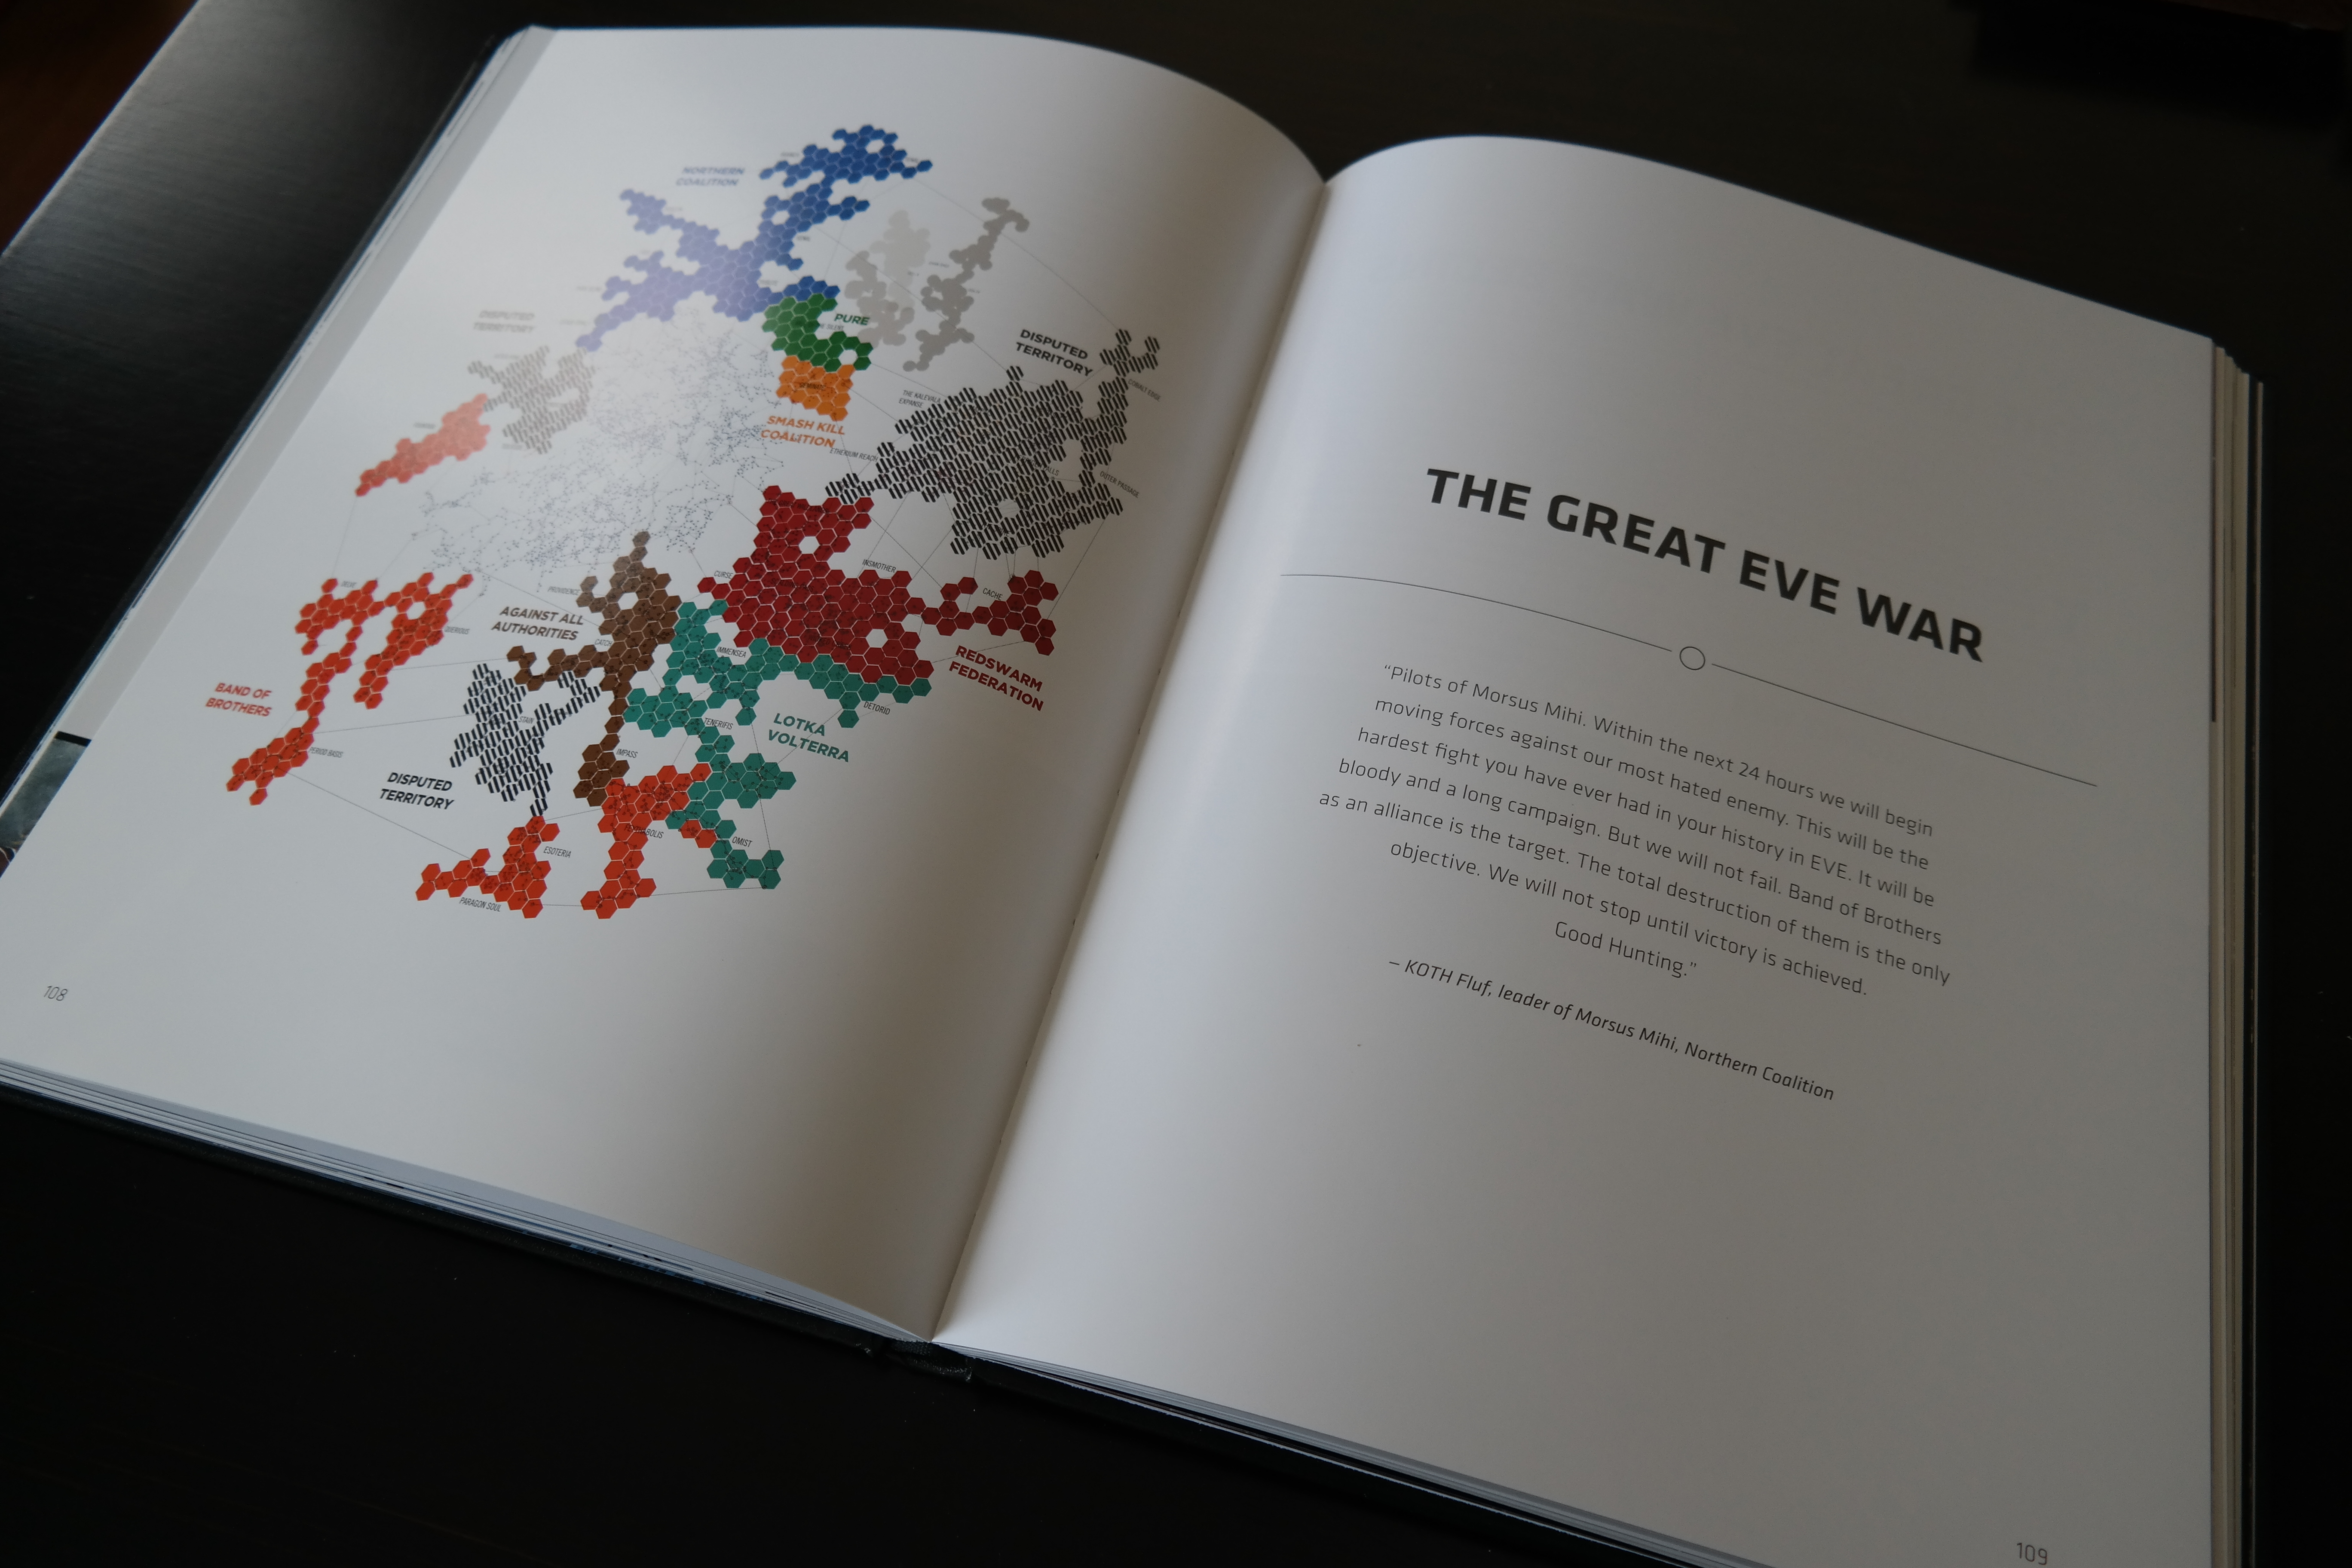
Empires of Eve
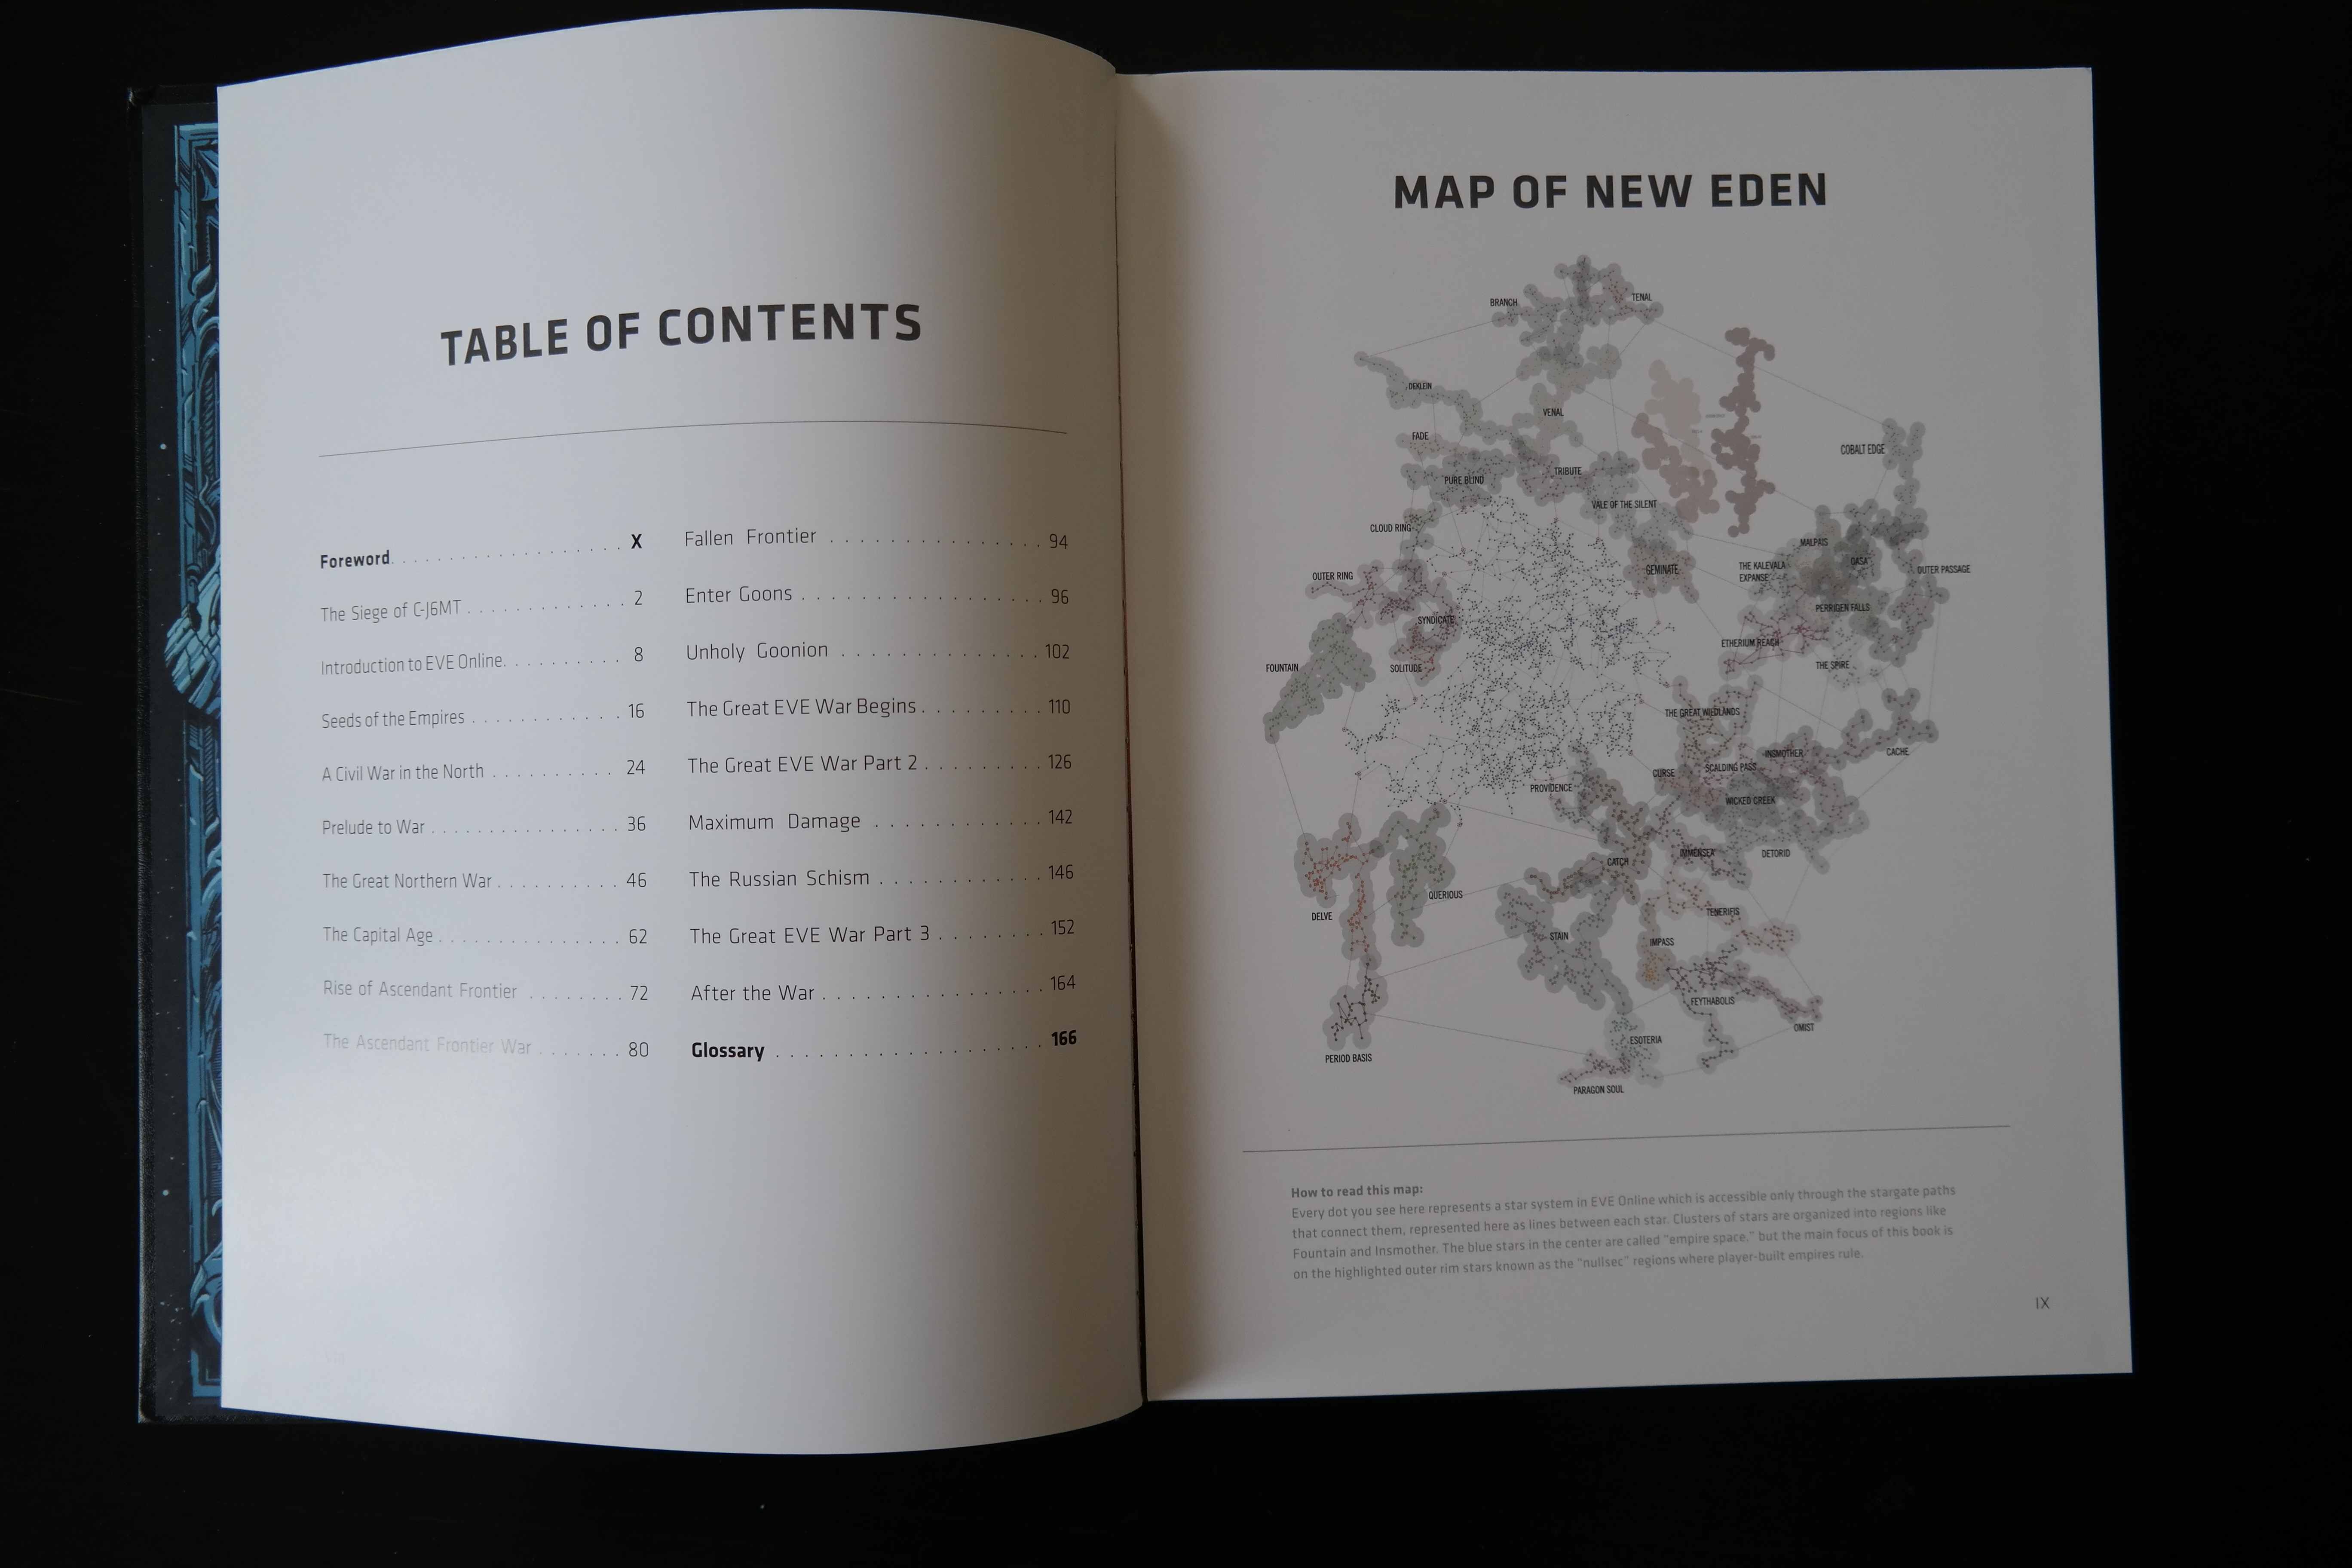
Posted: 2016-04-07 Filed under: eveonline, history, nullsec 1 CommentMy copy of Empires of Eve arrived today so here are some unboxing shots. If you can get the hardcover edition, purchase it. The finish quality and artwork really stands out.


spotmarket – 0.4
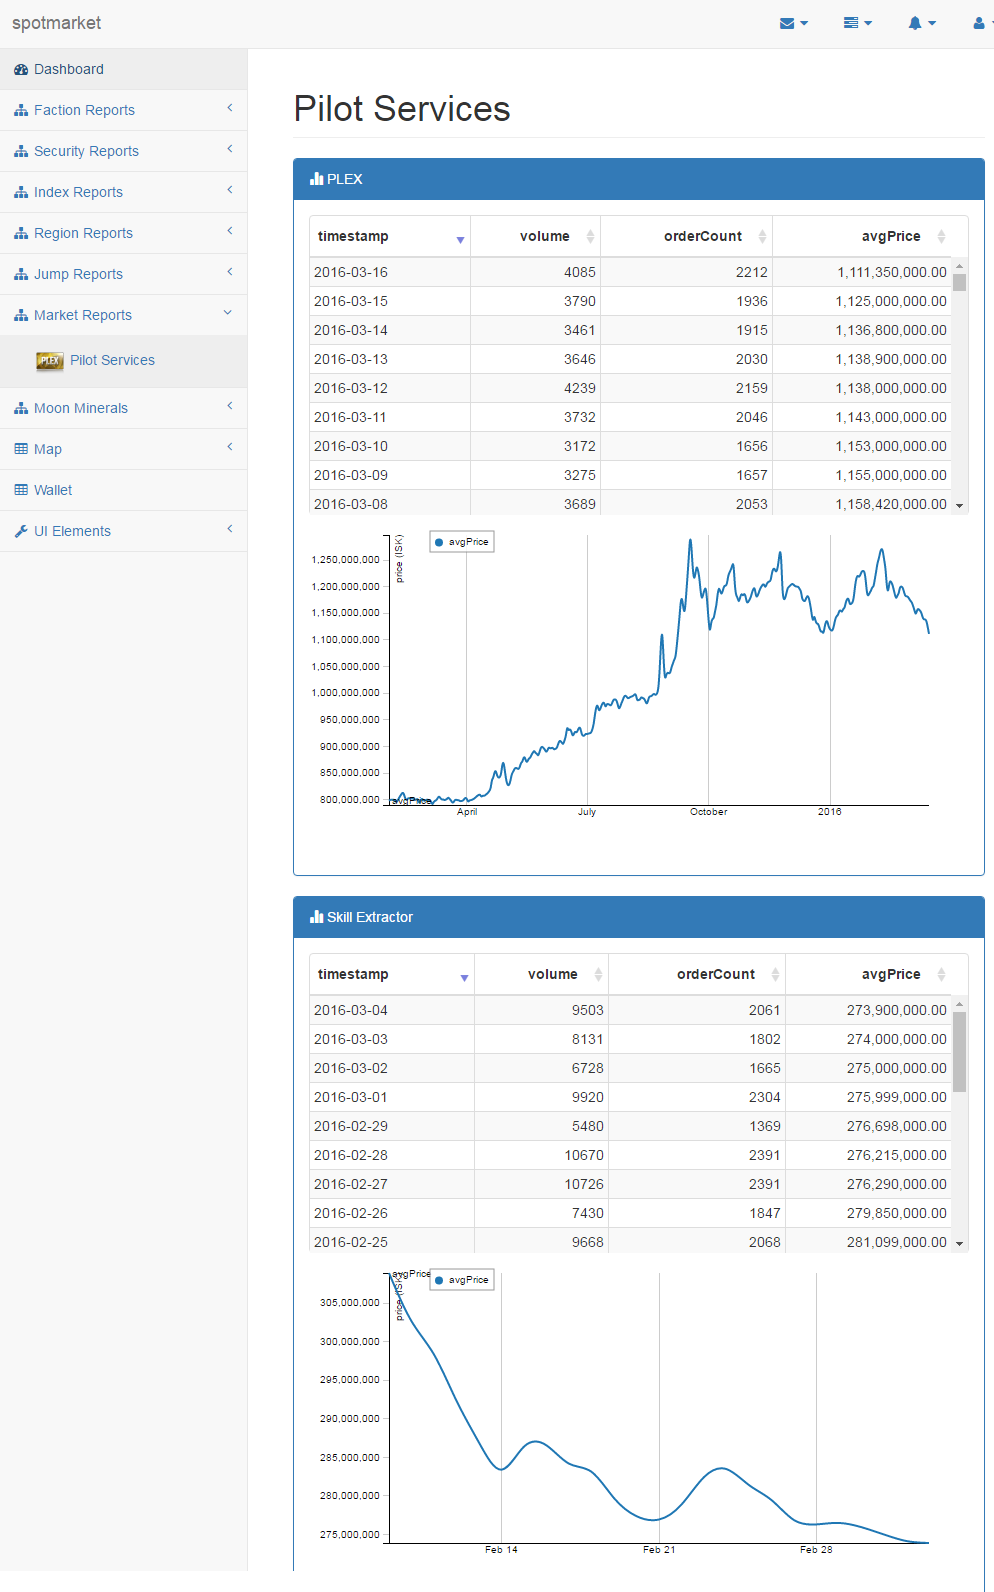
Posted: 2016-03-18 Filed under: python, spotmarket | Tags: amarr, dodixie, fountain, jita, PLEX, rens Leave a commentOverview
Whew, this was a big step in the right direction. I added a lot of sanity (keep everything in UTC), usability, and cleanup to the existing design. We’ve got moongoo, the beginnings of indexes, and CREST killmail data now flowing in to the growing dataset. The backend was improved by migrating to PostgreSQL 9.5.1 and I also cleaned up the install directions to try to make it easier.
[bug] Change timestamp for zkillboard and markethistory consumer to use UTC for mental sanity
[enhancement] Add 404 error page
[enhancement] Change to postgres 9.5.1 to support jsonb
[enhancement] Parameterize graph functions
[enhancement] Change date format in graphs to ISO for mental sanity
[enhancement] Standardize table formatting
[enhancement] Supervisor to make Flask web service persistent
[enhancement] Add jsonb index on data.killmails for typeID and solarSystemID
[enhancement] Add paging to zKillboard consumer
[enhancement] Add check to resume from last recorded page for zKillboard consumer
[enhancement] Add basic exception handling to zKillboard consumer
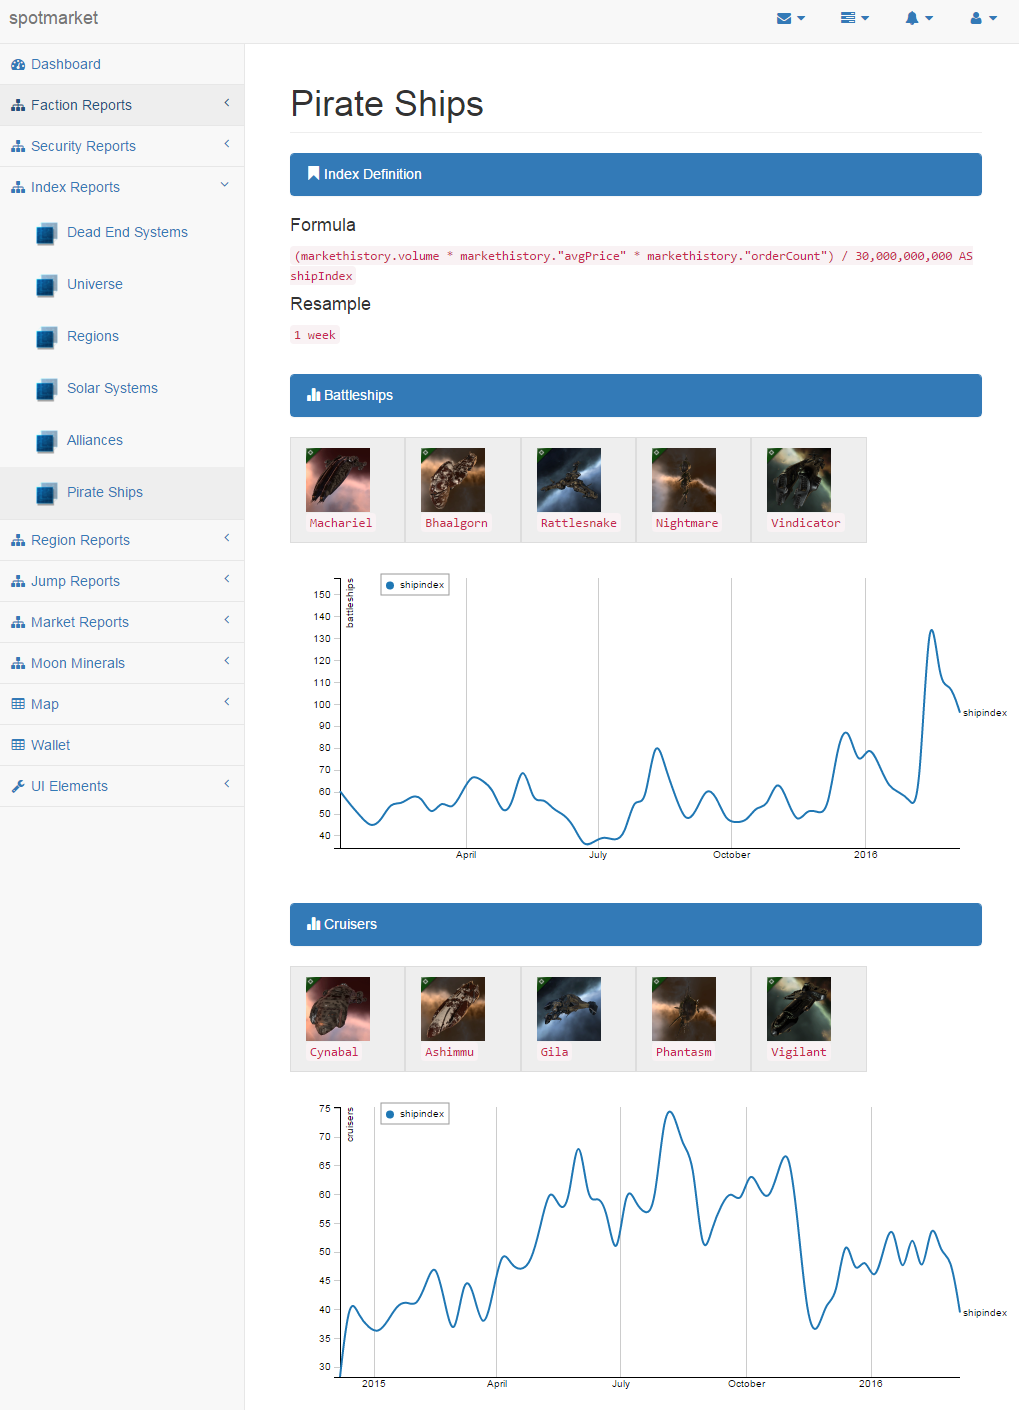
[new] Creation of ship index report
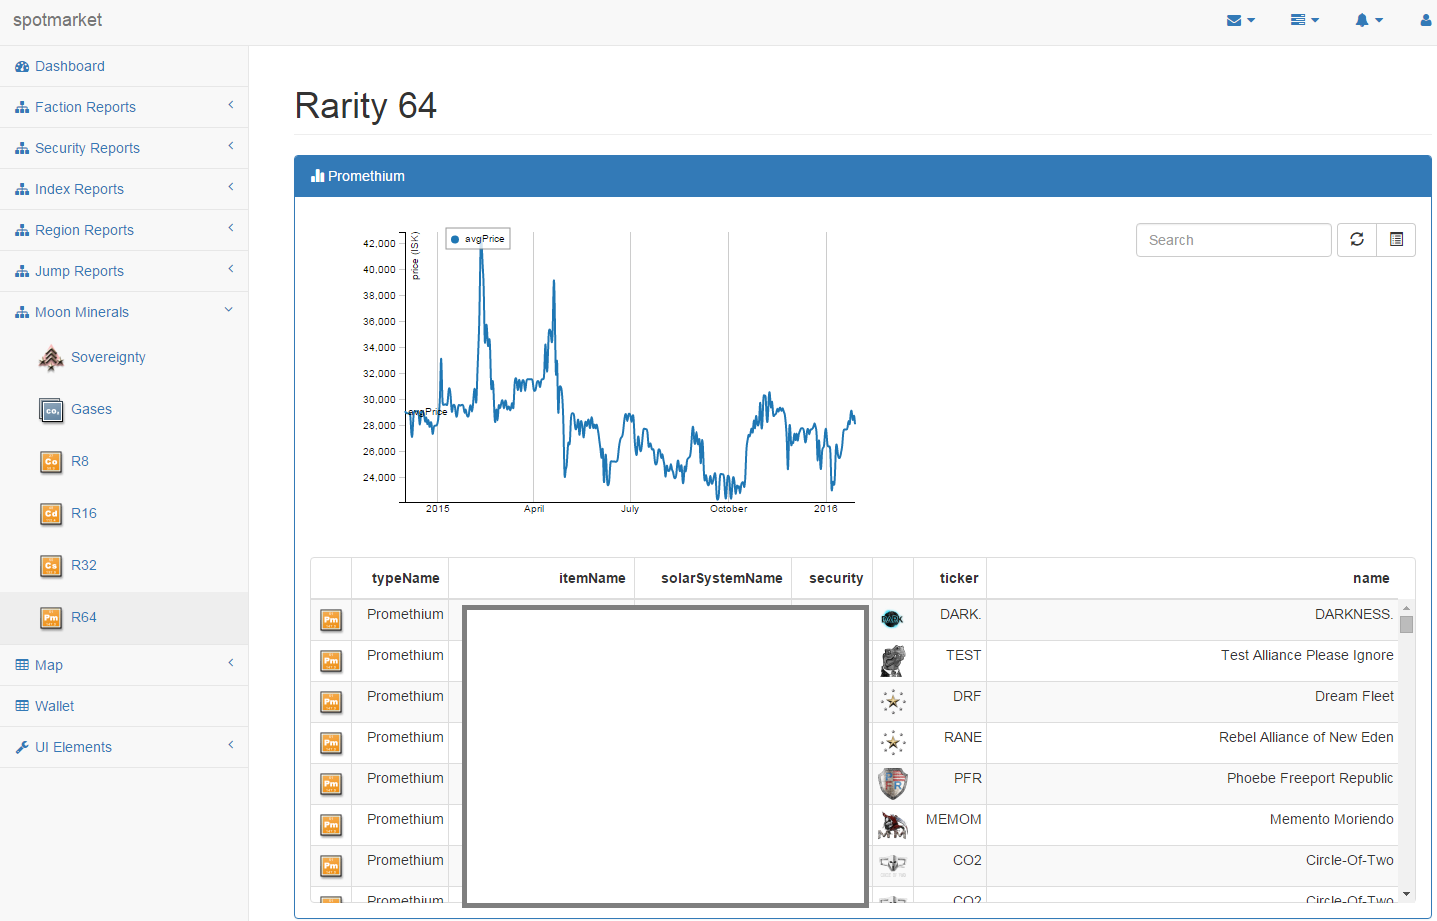
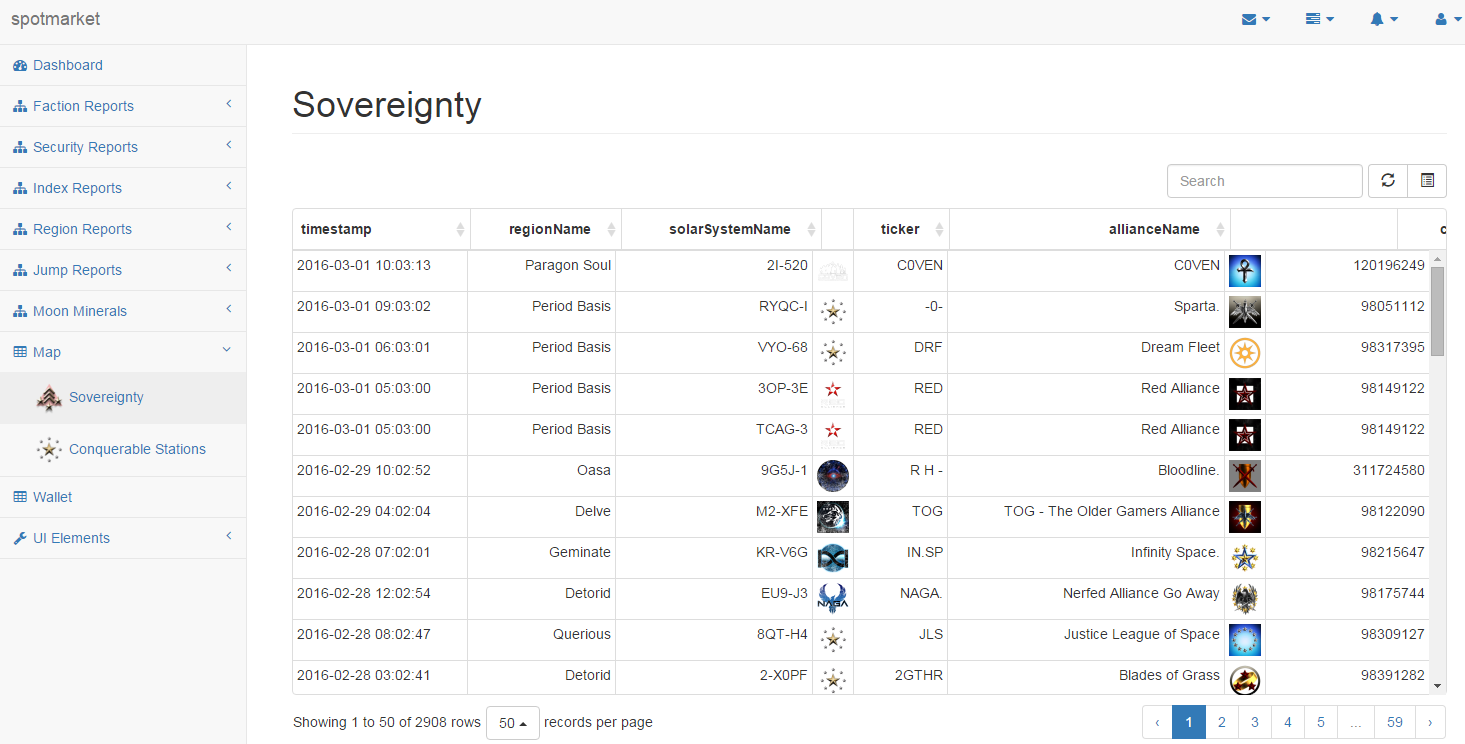
CREST Verified Moon Minerals
It is no secret that I have an affinity for finding accurate moon data. In a previous post, I’ve gone so far as to chart the regional density of each moon mineral, showing that there were built in skews as to where each type was placed for each class (R8, R16, etc).
In the Rubicon expansion, CCP introduced siphon units, which can be anchored near a POS to slowly leech items from within the shields. When an extractor is destroyed the killmail will show what moon mineral was in it. This, combined with the x,y,z location data that started to be exposed after the Parallax expansion, can be used to locate the nearest celestial object to give us a verified report of what moon mineral is contained in the object.
I gathered some examples for anyalisis, and over a long flight, I started to put some code together to use killmail x,y,z coordinates to parse CREST killmails. After implementation and testing, it has proven to be accurate so I’ve included the feature in this release. There is a manual step to get the moon mineral data into a table where it is used in the web frontend; I wanted to keep them separate to isolate the two datasets.
PostgreSQL Upgrade to 9.5.1
Rather than writing a parser for CREST killmails, I decided to store the JSON itself for simplicity. Developing on 9.3 with the json datatype proved to be a path that I did not want to go down. 9.3 is not the prefered version and lacked support for a fancy datatype inherit to 9.4+ and above. The following blog post also convinced me to migrate.
The proof is in the numbers so here’s a side-by-side comparison of the same query on the same dataset with only the datatype being different. The two virtual machines also had access to the same amount of CPU and RAM to control the results.
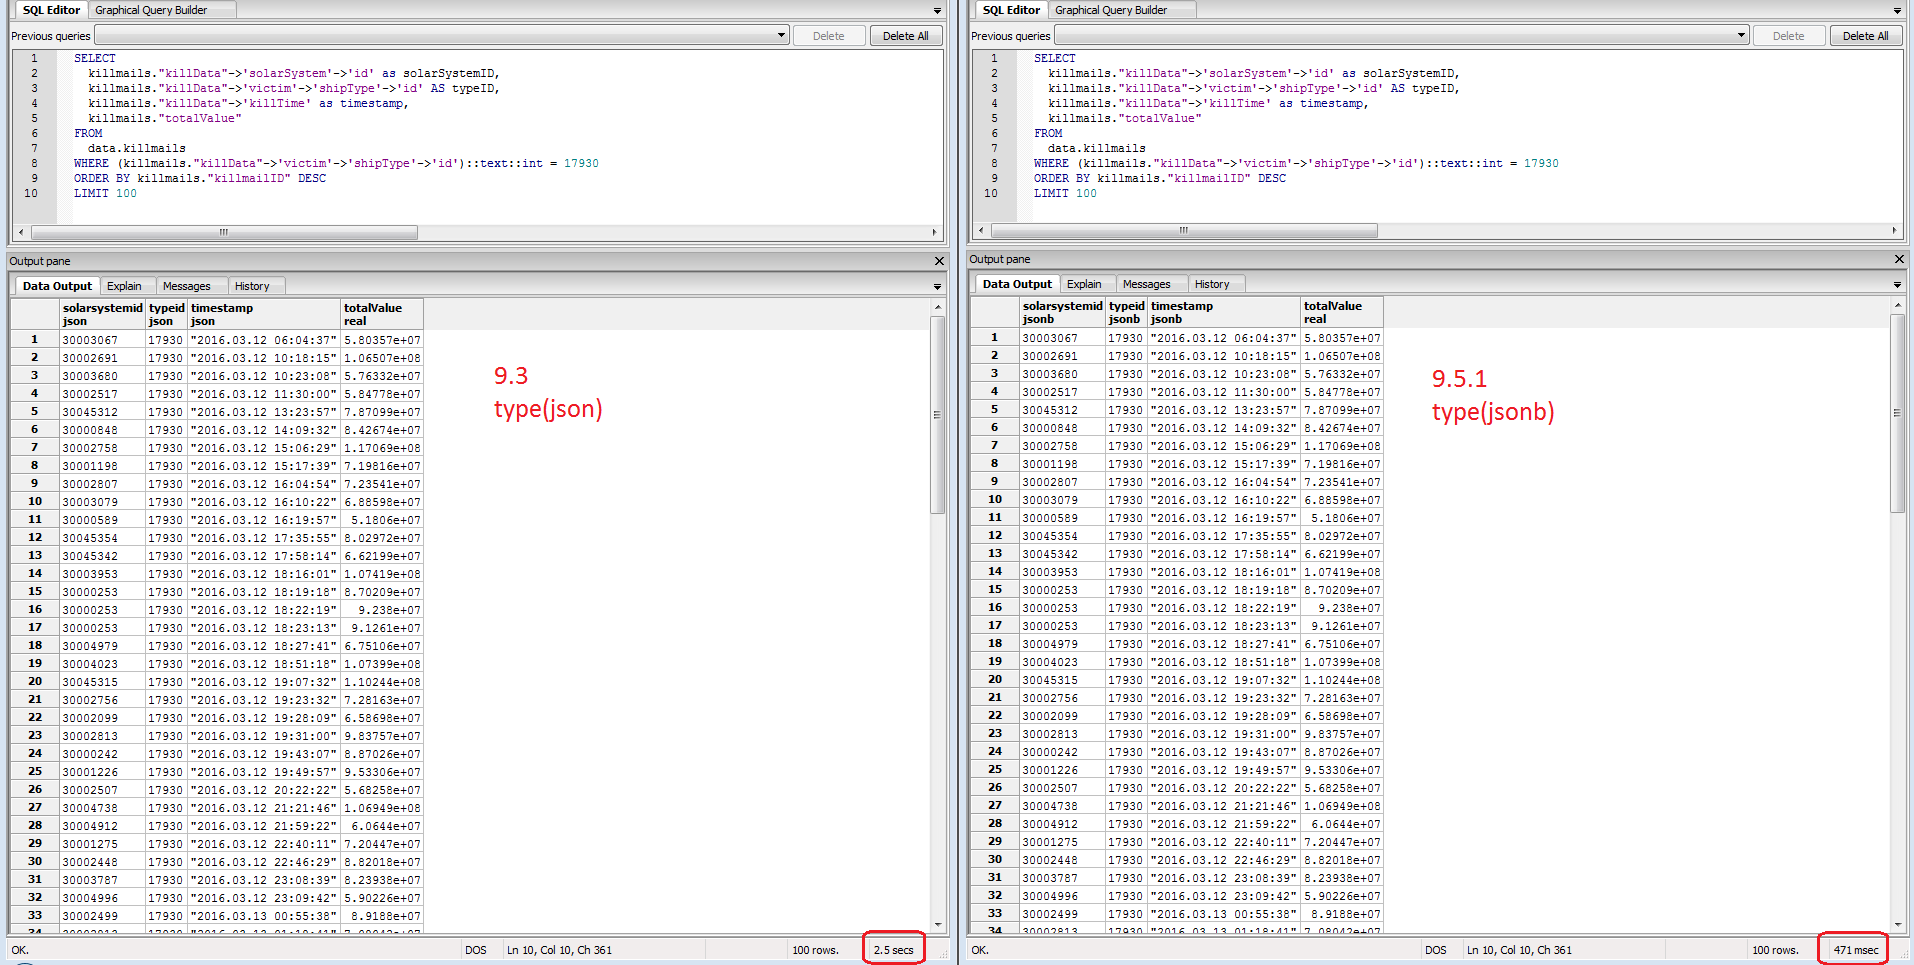
This query was proof enough that I made the right choice. Later that night while checking my logging table, I also noticed an improvement in insert speed.
9.3 (json) [kills] insert 2982 @ 93.81 rec/sec
9.5.1 (jsonb) [kills] insert 2850 @ 124.44 rec/sec
Not bad for about 45 minutes of testing and correcting install instructions.
0.5 Release
What’s up for the next release? Check out the TODO.md for a full list of items slated for each release. The main focus is going to be putting more control in the web front end, letting you enable/disable import items, add item to the market/zKillboard watch list, etc.
spotmarket – 0.3-dev
Posted: 2016-03-02 Filed under: market, python, spotmarket | Tags: d3.js, flask, pandas, r64, sansha 3 CommentsRapid Affirmative Coding
The last four weeks have been a rather busy development cycle for me. I finished up learning the basics of Python, have a working backend database, and have become more conformable with the frontend side of my platform. I’ve restructured a lot of items and have a vision down for the final architecture.

The end goal is to have everything in a Docker container so that anyone, anywhere can deploy; I want to aim for a ‘push-button-receive-data’ style of deployment. Let’s keep the IT wrangling to a minimum.
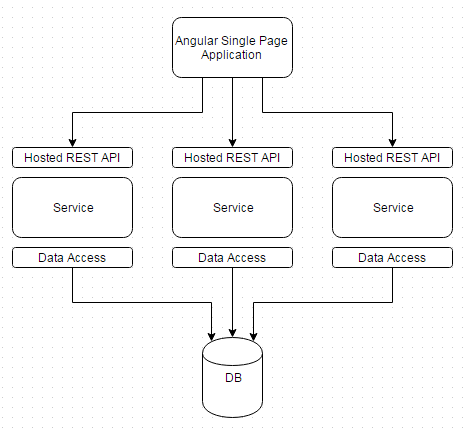
Currently the frontend that I have is build on Flask+Jinja2. As I have been developing the proof of concept out, I’ve found some limitations. James, who wrote the original trading program with me, has been pushing me towards AngularJS as the presentation framework.
Luckily I’ve kept to the original design principal of keeping every process that needs to communicate as an isolated component. With this design, any component can be replaced or moved and it is transparent to any other layer or neighboring service. Service ‘A’ could can be replaced with no impact to the front or backend, or the backend could be replaced with no impact to the services, and so on.
Laundry List of Improvements and Highlights
1. We’ve Got Data
2. Improved Database Inserts
I rewrote the insert statements to use primary key constraints to perform error checking rather than selecting if the row exists and then inserting. PostgreSQL does have an UPSERT statement that I would like to utilize to gain even further insert speed, but that will have to come when I update my PostgreSQL version to 9.5+.
Before: [kills] insert 3128 @ 49.85 rec/sec
After: [kills] insert 2948 @ 94.84 rec/sec
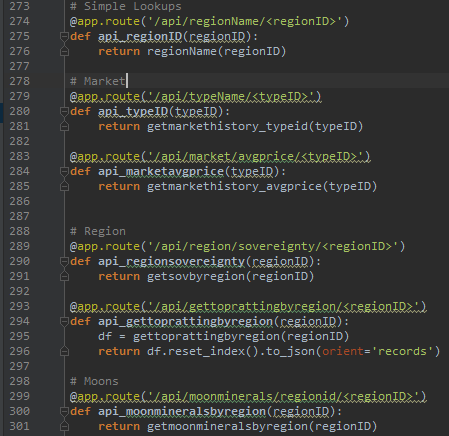
3. RESTful API
Any presentation item that needs data receives it over an JSON API.

4. Multithreading Flask
app.run(host='0.0.0.0', port=80, debug=True, threaded=True)

5. Using pgAdmin for Faster Query Generation

6. Current State
There is a lot of polishing needed, but a lot of the ‘bricks’ as I call them have been put in place. Learning the basics of D3.js, how to return JSON from Pandas manipulated PostgreSQL data, and bootstrap-table for modern table UI all have been on a punch list to learn to get to this state.


What’s Next?
- Bring on a partner that can help guide the frontend.
- Deciding if Flask+Jinja2 is really the right frontend platform for this project (and me).
- Migrating graphing to use height+length percentages rather than finite pixel amounts as the Bootstrap style supports many different formats. Currently the charts look horrible on any tablet or mobile device.
- Parameterize charts and graphs.
- Write consumer for CREST market prices.
- Write consumer for zKillboard/CREST killmails.
- Develop a proof of concept report for a Region that takes only the regionID as an input so that I learn how to build reporting for any region or Solar System.
- Leveraging the power of Pandas by spending more time on the thinking problems: developing Indexes, finding trends, and learning about covariance.
- Reach a good polish so I can publish a 0.3 release.
- Learning how to create a Docker image.
Latest updates can be found on the 0.3-dev branch.
