
spotmarket Graph Sample
Posted: 2016-06-07 Filed under: nullsec, pvp, python, spotmarket | Tags: amarr, branch, deklein, dodixie, fade, guristas, jita, pure blind, rens, tenal, the forge, tribute, venal Leave a commentWhat’s data without some graphs? Here is a small snip of the graphing that is currently in the spotmarket project.
Data
Jumps
2016-01-13 to 2016-06-07
17,802,640 Rows
Kill
2016-01-13 to 2016-06-07
9,819,421 Rows
Graphs
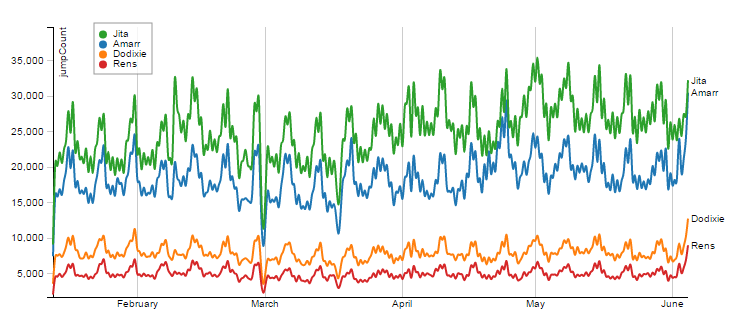
Jumps in Trade Hubs
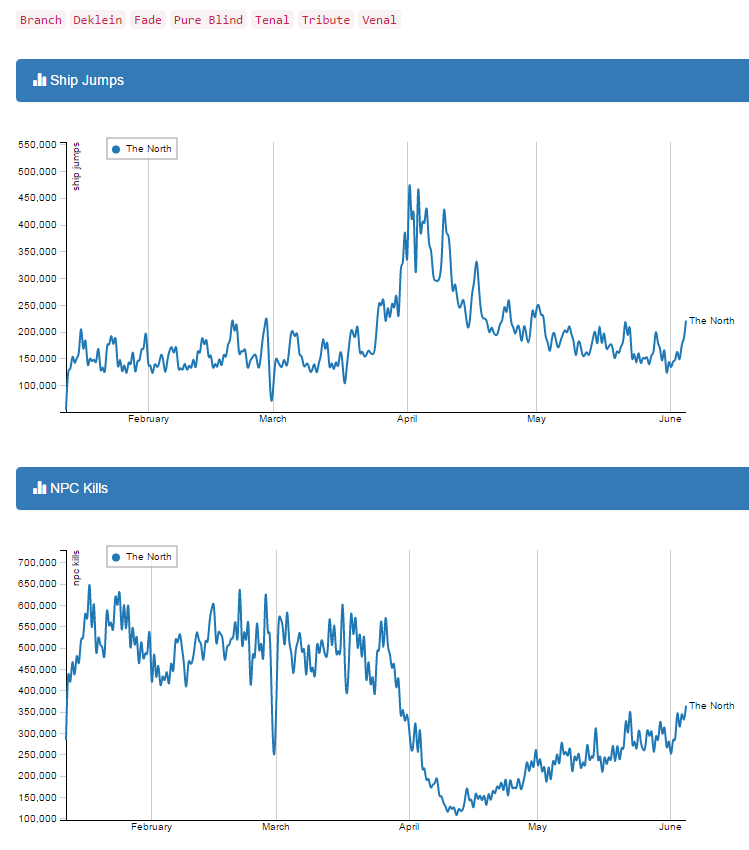
Jumps and NPC Activity in The Northern Regions
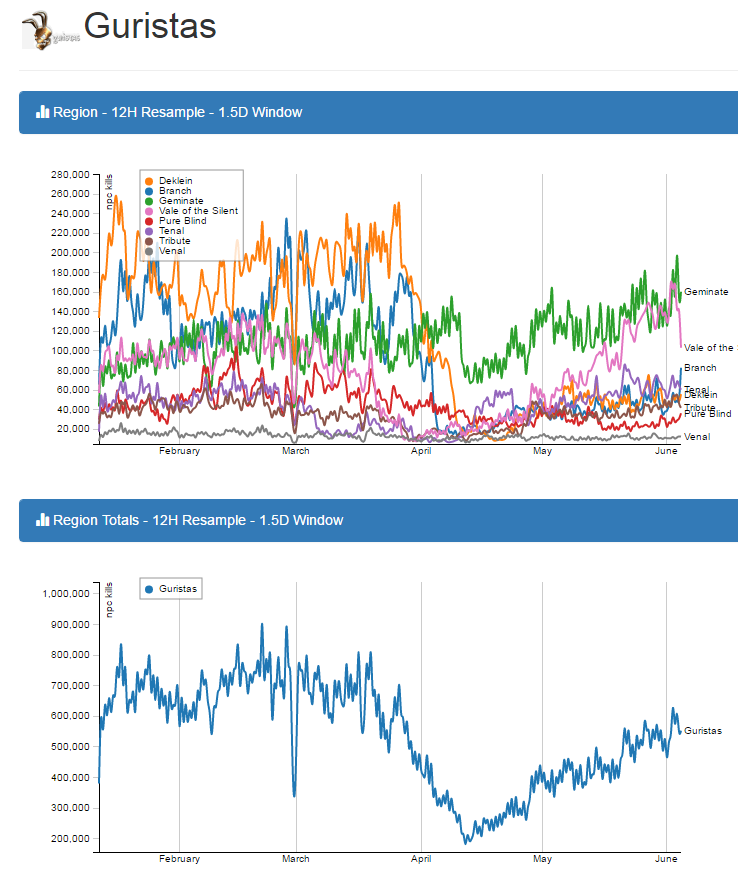
Gurista Ratting Rates
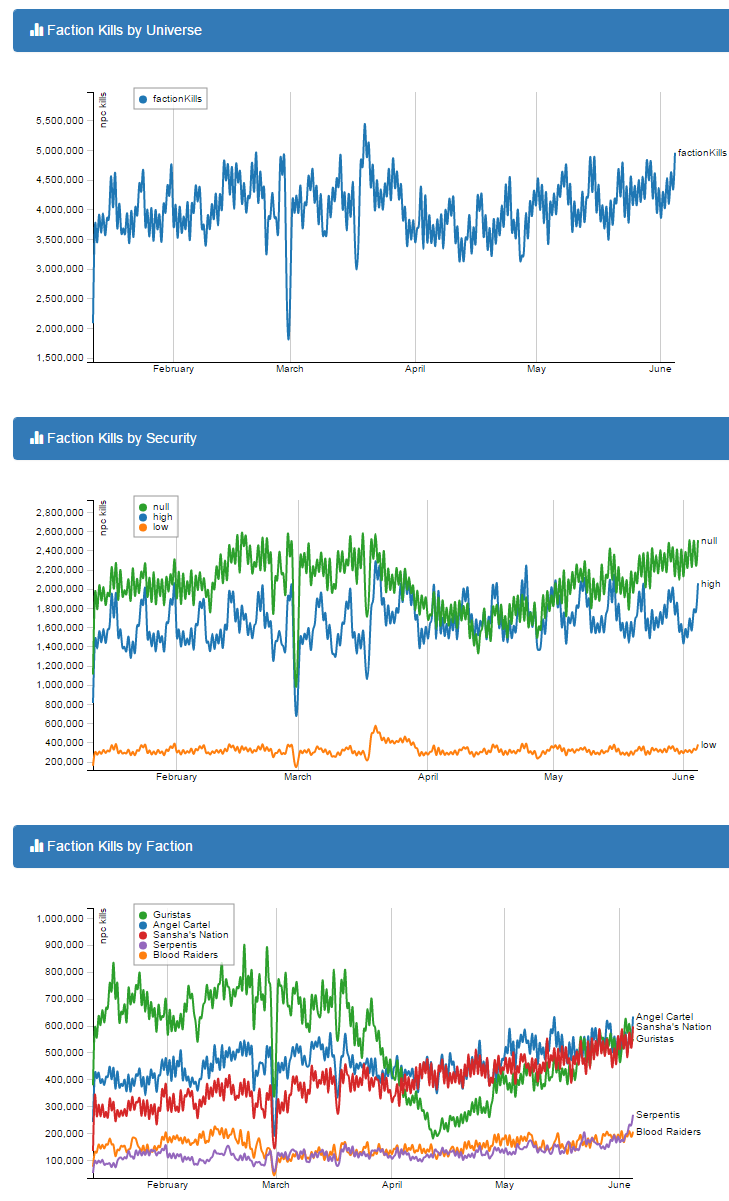
NPC Universe Overview
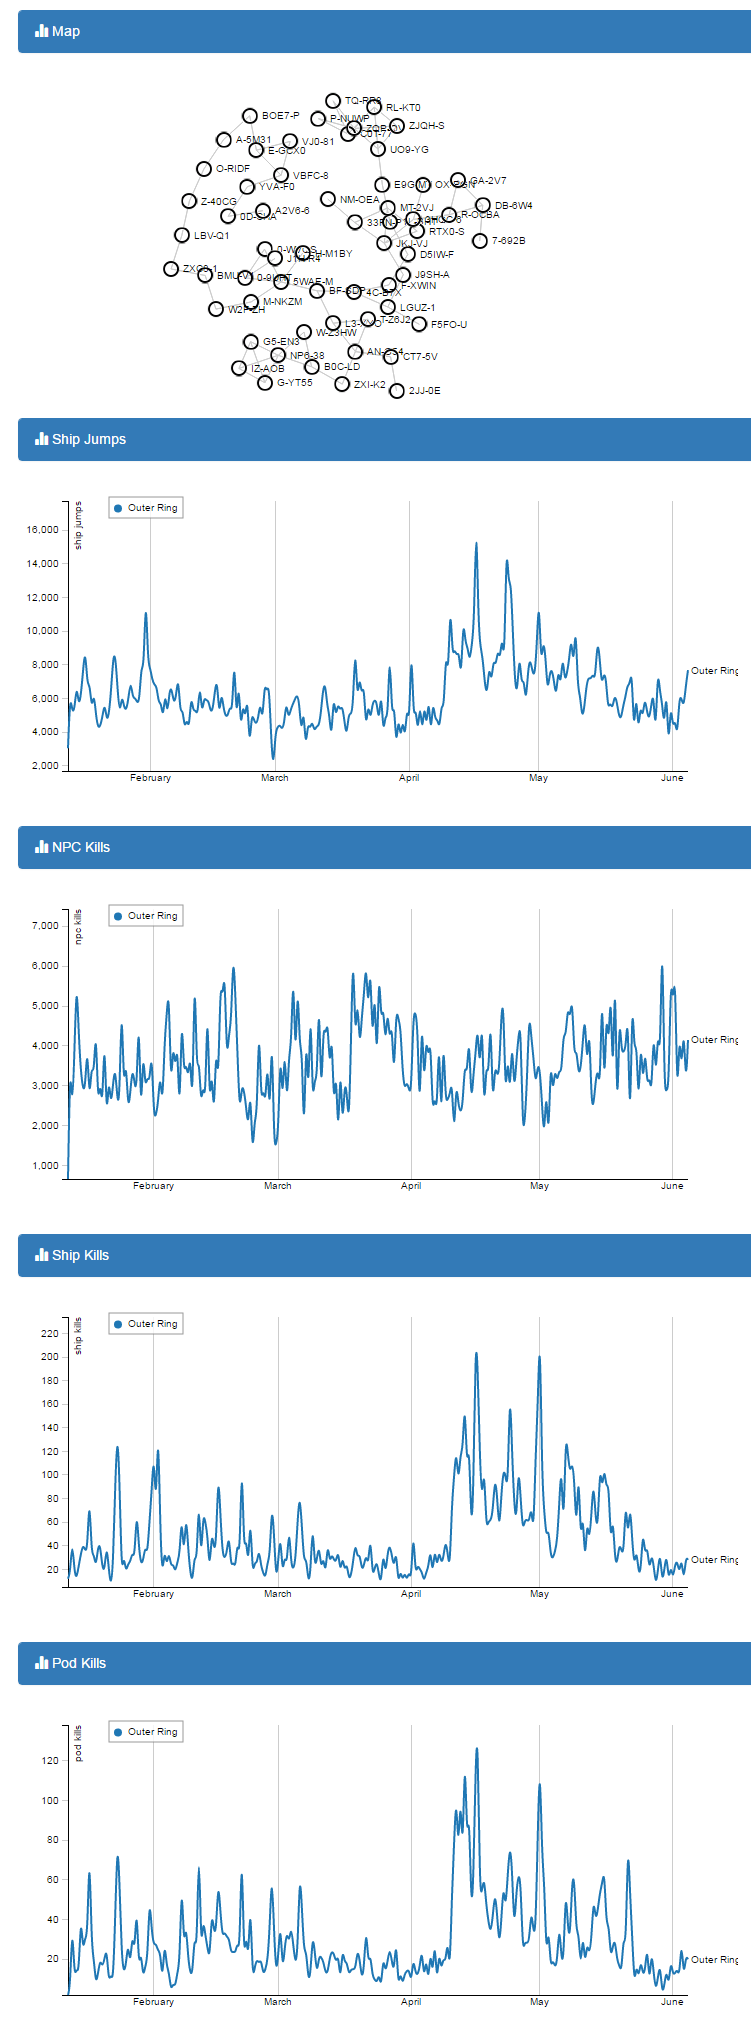
Outer Ring
First pass at a map using D3.js inspired by HelicityBoson at http://www.machine9.net/?p=1111.
spotmarket on Github
Posted: 2016-01-22 Filed under: python, spotmarket | Tags: d3js, jita, venal Leave a commentinitial commit
I published the initial code to GitHub with install directions for Ubuntu. The project so far is a Python script that consumes map API jump and kill activity and inserts them into a PostgreSQL database. Details as to why I picked these two items as starting points to come later.
https://github.com/brentnowak/spotmarket
So far this has been a fun learning project; I’m getting more familiar with Python datatypes/iterators/quirks, have been leveraging arrow for any datetime work, am getting more comfortable with pandas, and have a handle on the basic differences between MySQL and PostgreSQL.
Growing Laundry List
- Frontend – The previous project was written in a PHP framework and I have some basic JavaScript under my belt, but I am historically more of a backend/server focused person so web presentation is a weakness of mine. Django has been mentioned to me so perhaps I will do some research.
- Implement more efficient UPSERT to improve database insertion efficiency.
- Figure out what CREST market data to record.
- Start working on putting the pieces together for the first analysis — more on that later.
Screenshots
Jita Jumps

Presenting data with Python Pandas.

Manually extracting the data to a csv and charting it in D3.js for now.

