Tech 2 BPO Prices Post Crius
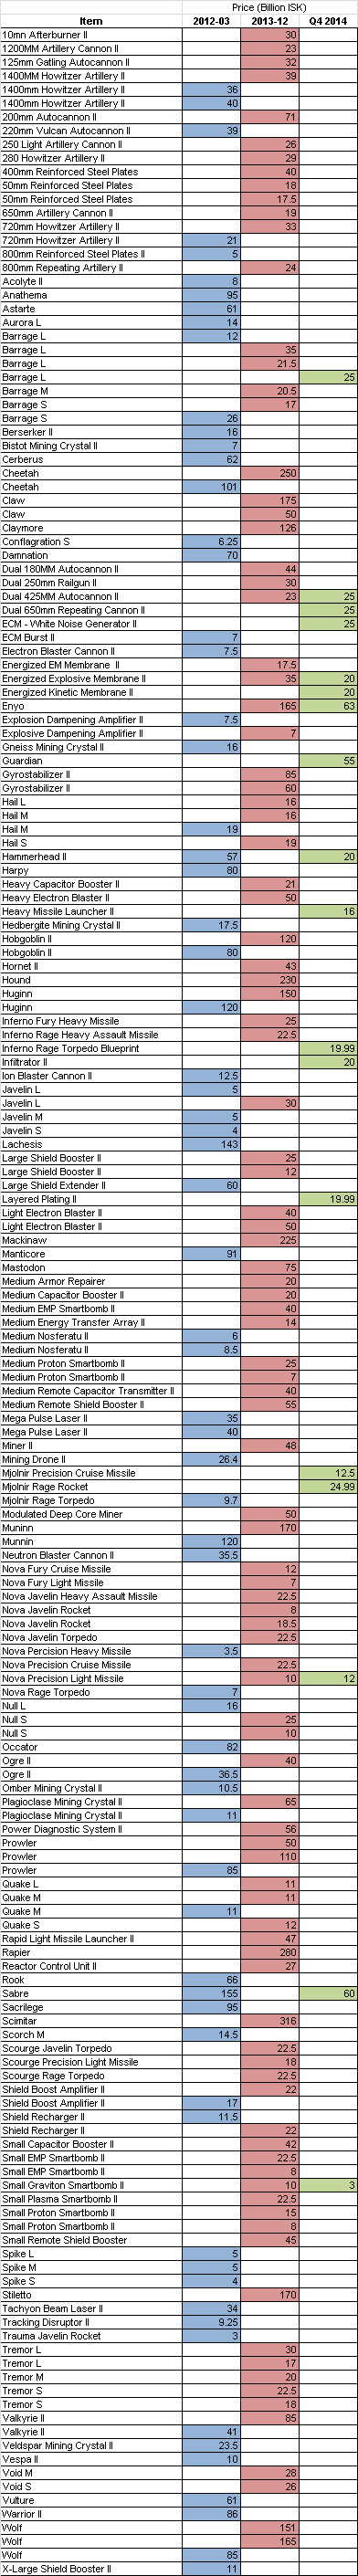
Posted: 2014-11-14 Filed under: industry, market | Tags: bpo, crius, tech2 2 Commentstl;dr Sale prices for Tech 2 BPOs are down an average of 47% after the Crius release.
Overview
Over the past few years I have been watching prices for publicly traded Tech 2 BPOs and attempting to record the values to the best of my ability.
Some sales completed non-publicly, some were vastly inflated, and some never sold. There is most certainly a lot of inaccuracy in the datapoints given the speculative nature of the Tech 2 BPO market, yet they still serve as guiding value to help us value the BPO.
The Post Crius Marketplace
The volume of posts in the official Sell Orders section of the forums are down, sellers are getting trolled, and people are re-running numbers to reprice the value of the BPOs trying to justify a much lower cost. I’ve seen a lot of CCP Dev intervention to clean up threads and keep people on topic. Overall the market is rather anemic.
Numbers
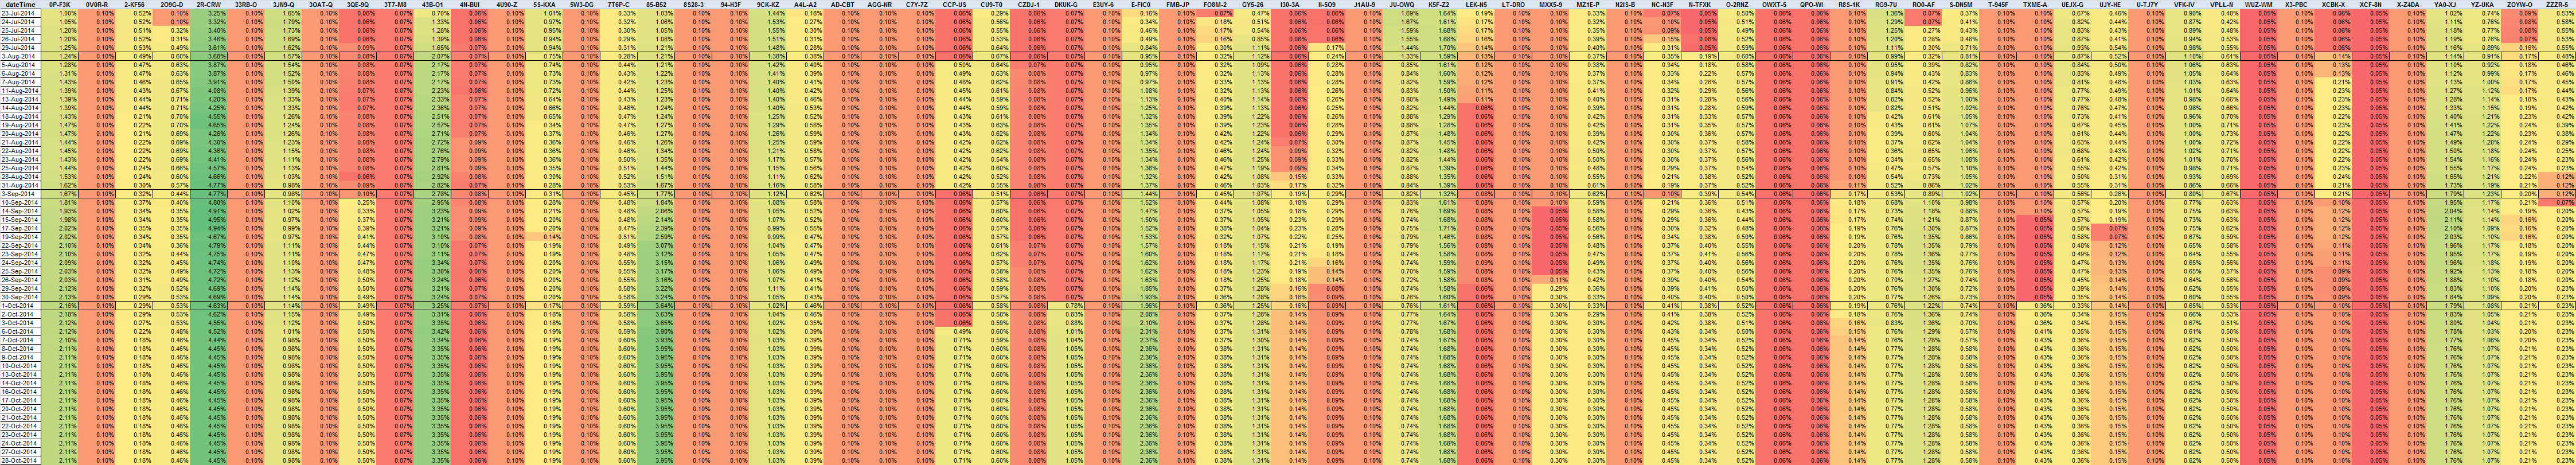
3 Months of Manufacturing Index Changes for Deklein
Posted: 2014-10-28 Filed under: industry, nullsec | Tags: deklein, VFK-IV Leave a commentI’ve started to accumulate a decent amount of daily index data and have started to use it to look at larger trends. Here’s a snapshot of Deklein region over the past 97 days.
One Month of Nullsec Manufacturing Index Changes
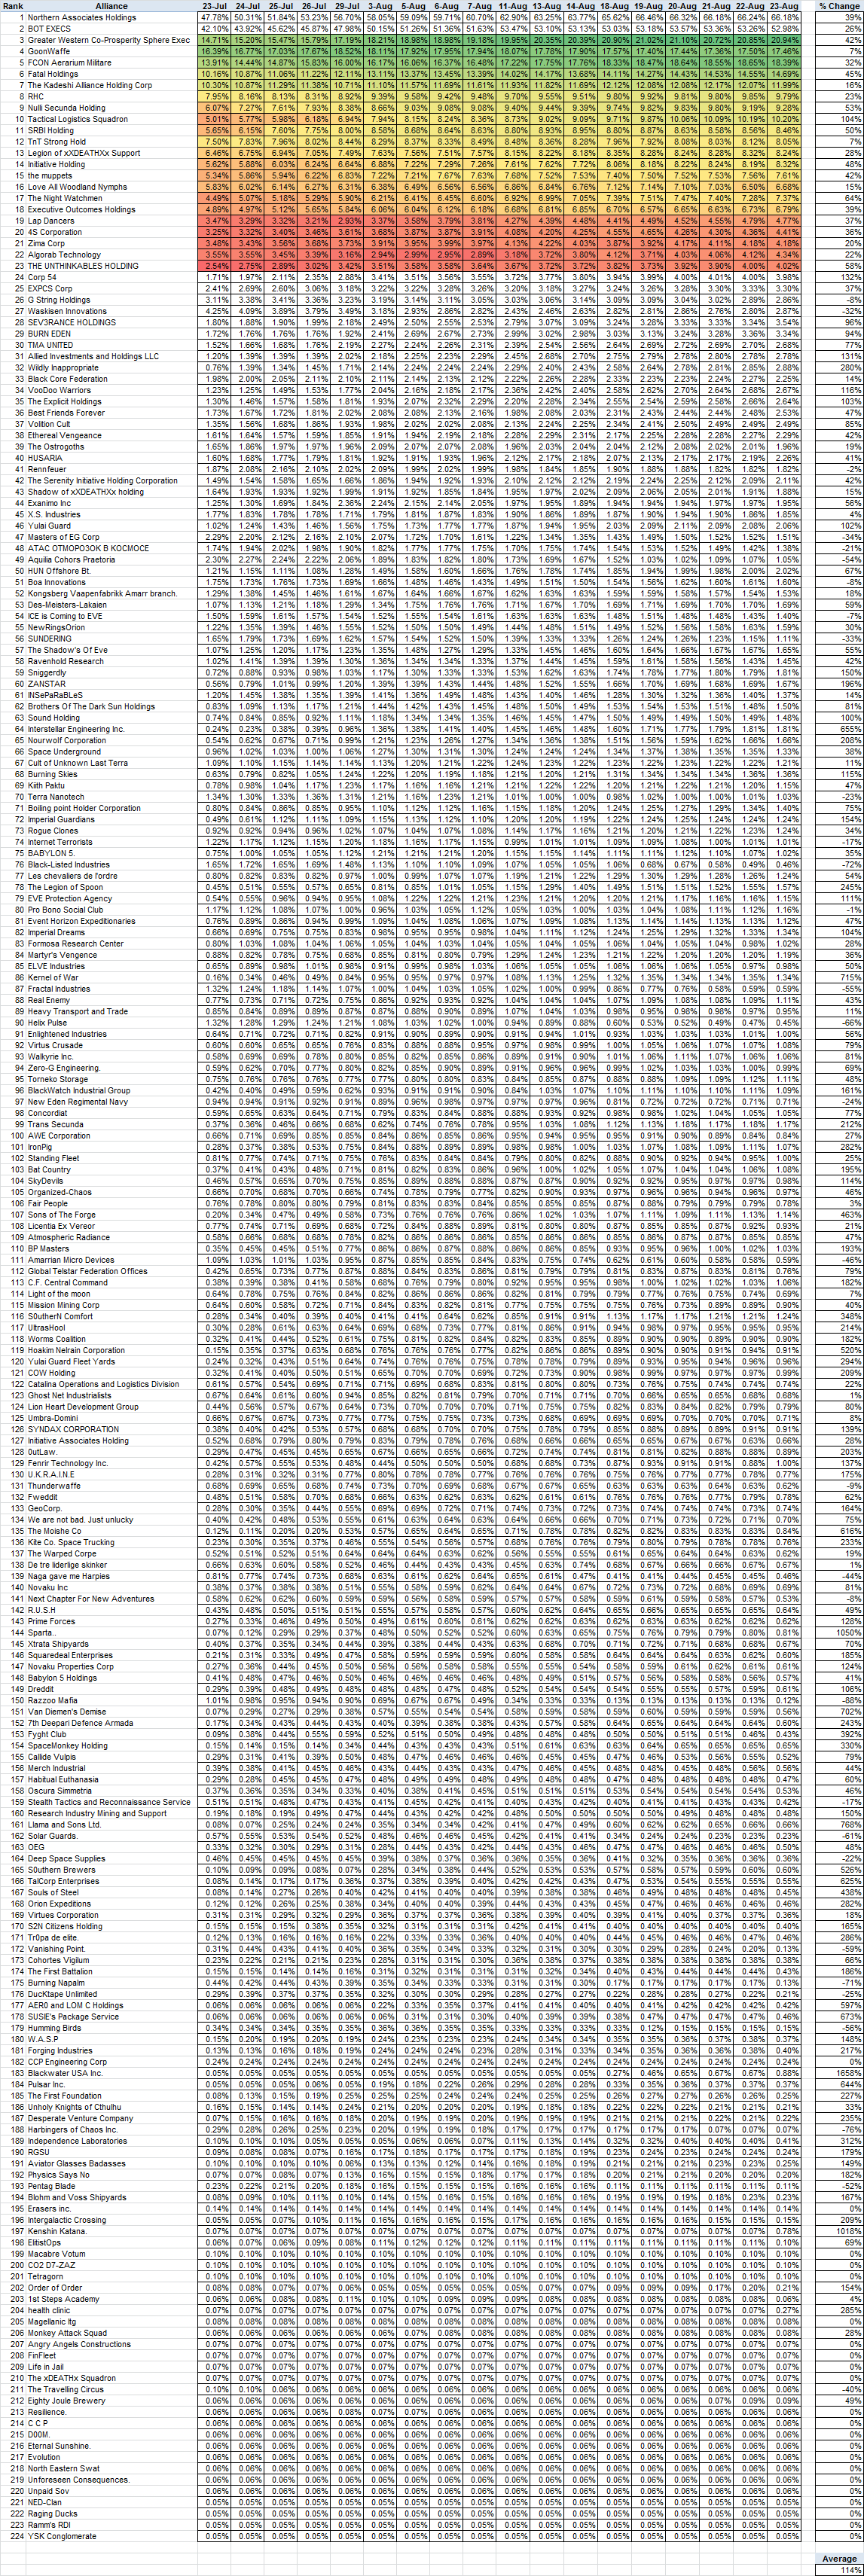
Posted: 2014-08-27 Filed under: eveonline, industry, nullsec 1 Commenttl;dr The amount of Nullsec manufacturing has increased from July 23rd to August 23rd.
The evolution towards independent, self-sustainable manufacturing in Nullsec is an area of high interest to me. I want trade and manufacturing hubs to develop beyond what we have today, but given the need to import materials for invention and Tech 2 production, I don’t see it happening given the current industrial framework.
I wanted to see if the steps taken in Crius were moving us in the right direction so I turned to my data. I’ve been recording the system Index data from the API on an almost daily basis so I joined this data with sovereignty data to see if Nullsec manufacturing has been increasing.
The top 50 corporations by sum of their production have shown an increase on average of 46%. The overall change for all corporations has been 114%.
The full table is available below with conditional formatting placed on a narrow band excluding outliers to better visualize the changes.
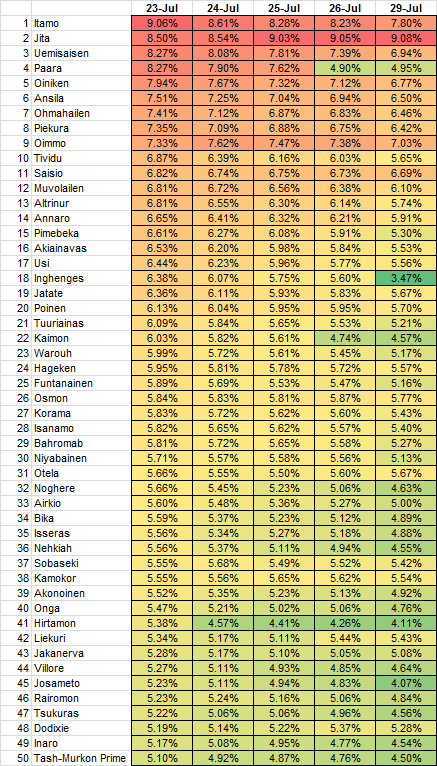
6 Days of Manufacturing Index Changes
Posted: 2014-07-29 Filed under: industry | Tags: crius 5 CommentsThe color shift indicates that manufacturing is spreading out and the landscape is starting to adjust to new levels. 67 systems have gone up more than 1% and 21 are down more than 1%.
Here’s a snapshot of the top 50 systems.
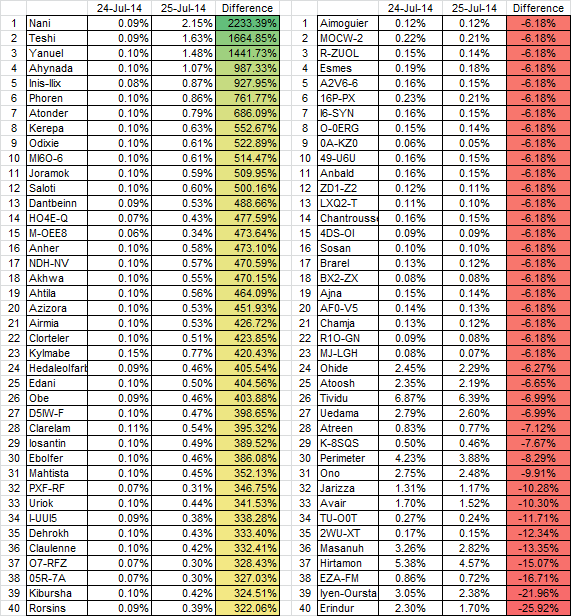
Initial Manufacturing Index Changes
Posted: 2014-07-24 Filed under: industry | Tags: crius 3 CommentsLooking at a 24 hour range in the manufacturing index data, it looks like people have started to move out of major manufacturing centers as the top 50 list has showing a drop across the board.
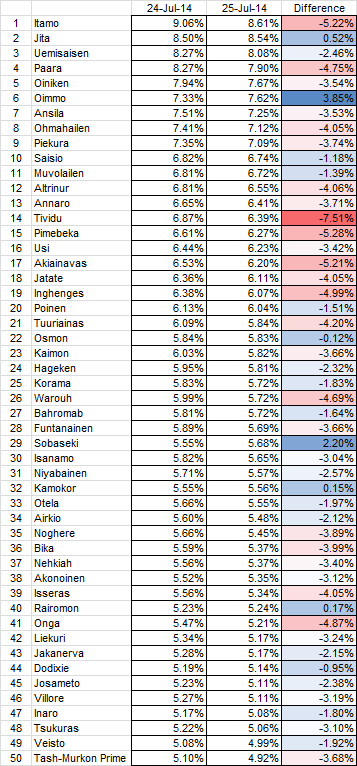
Here is a look at the biggest changes in the one day period. There has been a large amount of increase in many differing systems also indicating that manufacturing is spreading out.