
One Month of Nullsec Manufacturing Index Changes
Posted: 2014-08-27 Filed under: eveonline, industry, nullsec 1 Commenttl;dr The amount of Nullsec manufacturing has increased from July 23rd to August 23rd.
The evolution towards independent, self-sustainable manufacturing in Nullsec is an area of high interest to me. I want trade and manufacturing hubs to develop beyond what we have today, but given the need to import materials for invention and Tech 2 production, I don’t see it happening given the current industrial framework.
I wanted to see if the steps taken in Crius were moving us in the right direction so I turned to my data. I’ve been recording the system Index data from the API on an almost daily basis so I joined this data with sovereignty data to see if Nullsec manufacturing has been increasing.
The top 50 corporations by sum of their production have shown an increase on average of 46%. The overall change for all corporations has been 114%.
The full table is available below with conditional formatting placed on a narrow band excluding outliers to better visualize the changes.
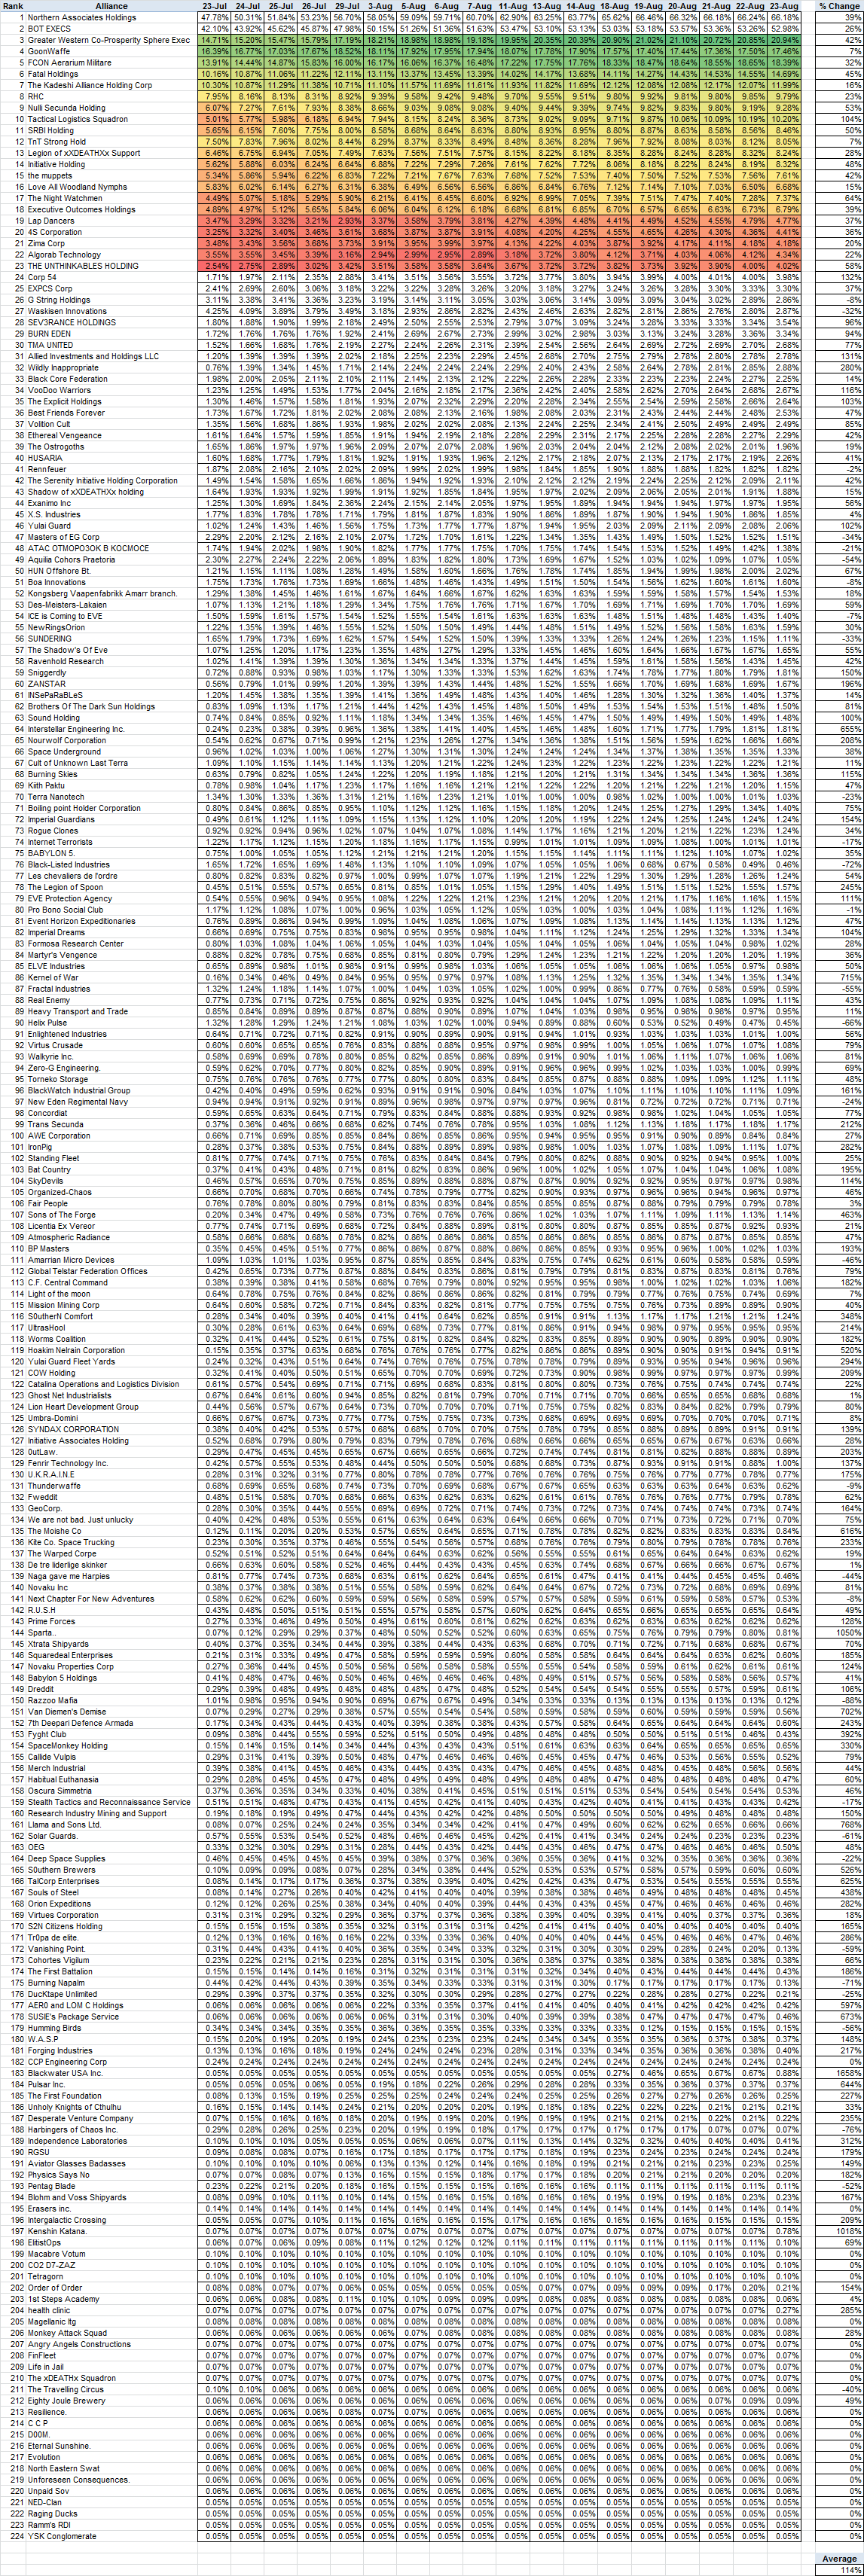

Your list is actually a list of corporations not Alliances, but it does show some interesting patterns.