
Historical Tech 2 BPO Prices
Posted: 2013-12-18 Filed under: history, industry | Tags: bpo, tech 2 1 CommentDisclaimer: Account for a large amount of inaccuracy with the price records that I have for Tech 2 BPO sales. The numbers that I have recorded are from scanning official and unofficial forums, chatting with industry counterparts, and some of the values have a price correction built into the value based on a ‘best guess’ from the record of a sale.
Is it better to trade or produce off of a Tech 2 BPO?
It turns out that it depends — the Tech 2 BPO market is highly speculative and subject to swings in price based on an items popularity given trends in balancing, fleet doctrines, or the sheer collectibility of the item. The prices that I have been able to record have been mostly public record. I’m sure that there is a tier of players that deal with blueprints off the record in private backchannels.
Data Scope
Taking data that I have from my previous post on Tech 2 BPO Returns, I did another scan of prices and added them to my records. This gives me a sampling of prices from 2012-03 to 2013-12, a 21 month span.
Sale Prices
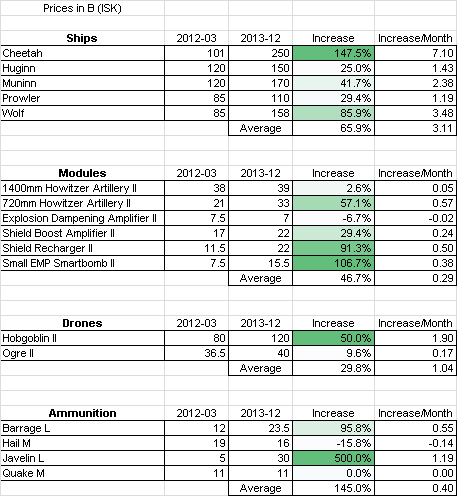
The performance of each item varied so I grouped them into ships, modules, drones, and ammunition.
Ship prices are the most stable return, modules second, and then followed by drones. Ammunition seems to be a volatile market; I am not surprised with the Tech 2 BPO value over time for ammunition as I have seen similar volatility with sales as noted in my Trading Performance: Ammo post.
Producing vs Investing
Using the Muninn as an example of a average performer and having the BPO in constant production would yield around 246 per year coming in at 50.683 M profit per hull, or 12.47 B a year of profit.
Our production profit would be around 1.04 B a month and my sheet on the increase of value shows the BPO increasing at 2.38 B per month. It turns out holding on to the print is more valuable than producing off of it.
tl;dr Conclusion
Invest in Tech 2 BPOs that fall under the ship and module category, produce off of them for a year, and resell the item for a higher value.
Relocating Capital Building Operations
Posted: 2013-12-18 Filed under: industry, market, nullsec, ships | Tags: archon, chimera, delve, fountain, G-TT5V, moros, naglfar, nidhoggur, revelation, thanatos Leave a commentWith the stabilization of the Fountain and Delve regions over the past few months, the amount of sales we have seen in our building system have decreased. Raath made a command decision to leave the region in search for greener pastures.

Operation Performance
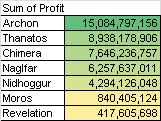
Our time in G-TT5V spanned 385 days where we built 162 capital hulls to sell on the local market. Our sales totaled 221.4 B ISK with a total profit coming in at 43.3 B. Performance metrics show a margin of 4.1%, an average of 3.4 B per month in profit, and a velocity of 5.06 hulls moved per week.
Top Performers
Given the balance changes to the Naglfar hull that came in the Odyssey update, we have seen a very strong demand the the hull; it is not a surprise that it has been a top performer. If you want to mass build, pick the Archon or Thanatos.

Capital Hull Profit Margins Trends
Posted: 2013-12-06 Filed under: industry, market, ships | Tags: archon, chimera, moros, naglfar, nidhoggur, revelation, thanatos Leave a commentAfter two months of Eve downtime to move across the country to start a new job, I wanted to report on how Capital sales have been performing as Raath has been leading the construction of capitals hulls in my absence.
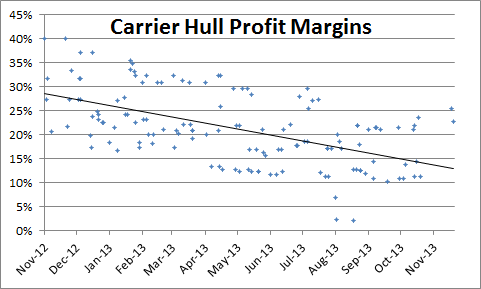
Carrier Hulls
Looking at sales from 2012-06 to 2013-11, we are faced with shrinking margins on Carriers. With 139 data points covering over a year of sales, I think it is fairly easy to justify a trend from the data. The highest demand we saw was when TEST was defending Fountain, as the Slowcat doctrine was a training goal for a lot of pilots.
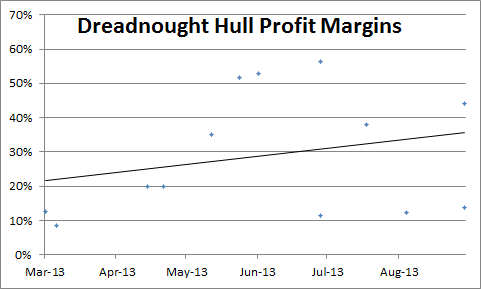
Dreadnought Hulls
We have a much smaller dataset to work with for Dreadnoughts as the BPOs and workflow for incorporating them into the production line was a fairly recent addition. With only six months of sales data, it is hard to draw a strong conclusion but the margins look to be holding stronger than Carriers. I attribute a lot of our strong numbers holding Dreadnoughts up primarily due to the Naglfar rebalance in the Odyssey expansion; their profit margins are holding up around 40% on average due to demand, and plus it is cool vertical hull.
Note: we are not building the Phoenix hull due to general terribleness.
Jump Freighter Kill Statistics
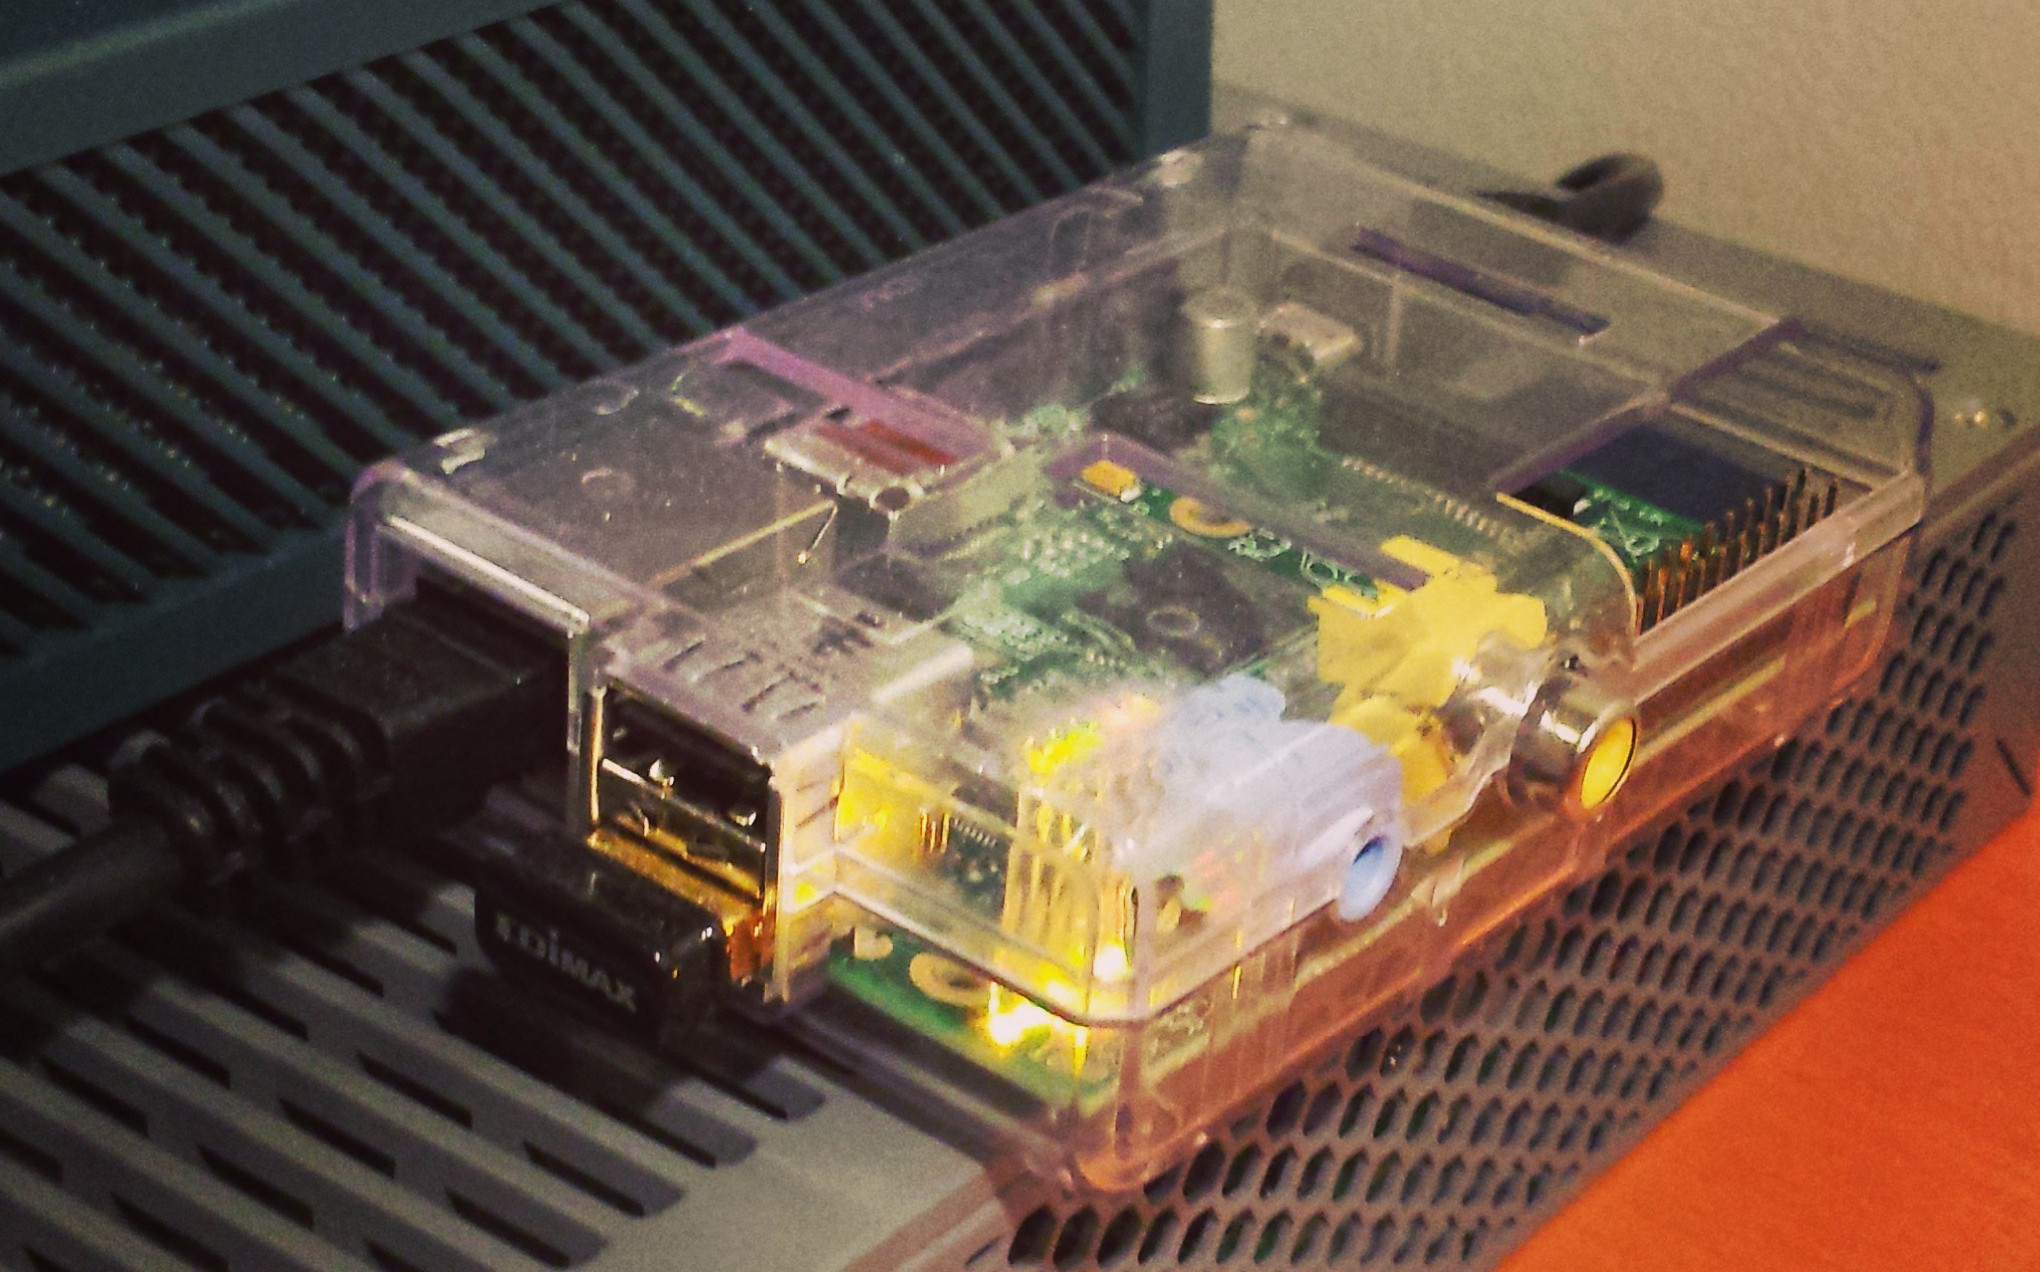
Posted: 2013-12-04 Filed under: eveonline, industry, market | Tags: anshar, ark, nomad, purjola, rhea, sagain 4 CommentsI’ve been working with @Lockefox over the past few days to setup his Eve-Prosper zKillboard scraper on my Raspberry Pi LAMP instance that I have in my home lab in order to do some data analysis.
Let there be Database Rows
The only edits that I had to make to the project code were the database connection details in scraper.ini and a narrowing down of ship classes listed in toaster_shiplist.json. After getting the data into mySQL and importing the invTypes and mapSolarSystems tables from the static dump into my database, I could start to filter and sort the results.
Kicking off the scraper:
pi@charon ~/eve_prosper $ python zkb_scraper.py — startdate=2013-12-01DB Connection: GOODzKillboard connection: GOODno crash log found. Executing as normal…Parsed Capital Industrial Ship: [200, 29713239, 0, ‘2013-04-08’] sleep=20.0Parsed Capital Industrial Ship: [290, 27468307, 1, ‘2012-12-30’] sleep=20.0
Here is the query to get Racial JFs and also include the solar system name and security value:
— Get Racial JFs
SELECT destruction_data.date, destruction_data.week, destruction_data.typeID, destruction_data.systemID, destruction_data.destroyed, invTypes.typeName, mapSolarSystems.solarSystemName, mapSolarSystems.security
FROM destruction_data
JOIN invTypes
ON (destruction_data.typeID = invTypes.typeID)
JOIN mapSolarSystems
ON (destruction_data.systemID = mapSolarSystems.solarsystemID)
WHERE destruction_data.typeID IN (28850, 28844, 28848, 28846)
ORDER BY destruction_data.date DESC
Results
Out of 975 Jump Freighter kills covering 334 days, there is an average of 20 a week killed. It turns out that you are most likely to get caught in Lowsec in a Rhea.
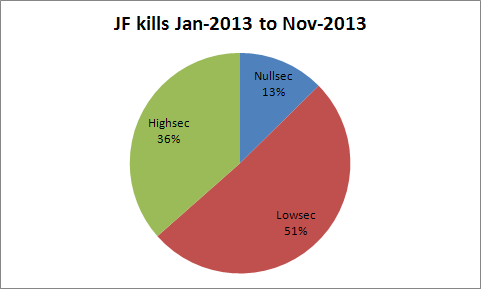

When we look at kills by system, Purjola (0.5), a Highsec system in the Forge stands out as the system with the most losses at 54. Not surprisingly the Lowsec system of Sagain (0.4) comes in second, most likely due to the terrible kickout station that I have covered here.

More coming soon as I start to think of what types of statistics and trends I can pull out of the data. If you have something you would like me to look at, please leave a comment or tweet @K162space.
