
spotmarket – pivot and resample
Posted: 2016-01-29 Filed under: market, python, spotmarket | Tags: blood raiders, cloud ring, delve, fade, fountain, outer ring, period basis, querious, serpentis, syndicate Leave a commentOverview
I published v0.2, which includes a bunch of hacked together proof of concept code. This week I dove into the pandas library, focusing on the data manipulation tools that are inherit to pandas. This post covers some of the highlights and demonstrates the initial charting that I’ve been producing.
More to come on what I plan to do with the data; for now those details have to be a trade secret.
Data Frame
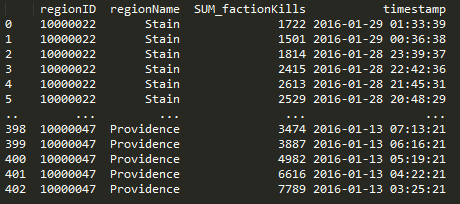
The crux of pandas is the dataframe and this week I discoverd that you can load your query results right into a dataframe and not have to write a parser. Notice in the below code that I run the query and place the results into a dataframe with a ‘fetchall()’. This really saves me a lot of headaches when passing around chunks of data and makes it easy to write functions to combine data with overlapping values. Return the dataframe and do more ::work::.
Here’s a query that I use to get NPC kills by region when given a regionID.
def getnpckills_byregion(regionID):
    conn = psycopg2.connect(conn_string)
    cursor = conn.cursor()
    sql = """SELECT
      "mapSolarSystems"."regionID",
      "mapRegions"."regionName",
    SUM(mapkills."factionKills") as SUM_factionKills,
      mapkills."timestamp"
    FROM
      data.mapkills,
      public."mapRegions",
      public."mapSolarSystems"
    WHERE
      "mapRegions"."regionID" = "mapSolarSystems"."regionID" AND
      "mapSolarSystems"."solarSystemID" = mapkills."solarSystemID" AND
      public."mapSolarSystems"."regionID" = %s
    GROUP BY mapkills."timestamp", public."mapSolarSystems"."regionID", "mapRegions"."regionName"
    ORDER BY timestamp DESC
    """
    data = (regionID, )
    cursor.execute(sql, data)
    df = pd.DataFrame(cursor.fetchall(),columns=['regionID', 'regionName', 'SUM_factionKills', 'timestamp'])
    cursor.close()
    return df
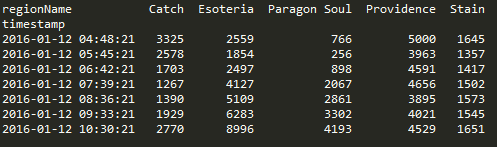
Pivot
Doing a pivot in pandas is amazingly elegant and you can perform the operation in one statement.
df.pivot(index='timestamp', columns='regionName', values='SUM_factionKills')
Resample
Another powerful tool in the library are the resampling options. I’m still trying adjusting the parameters to find a balance on data granularity.
The below graphs show NPC kills over all regions over time. One graph has no resampling while the other has values that I feel display a daily value, normalizing the peaks and valleys that occur due to server downtime and differing activity rates due to timezone.
conversion = "12H"
v_window = 8
v_minperiods = 1
pd.rolling_mean(df.resample(conversion, fill_method='bfill'), window=v_window, min_periods=v_minperiods)


Results
Ratting activity in Blood Raiders regions:


Ratting activity in Serpentis regions:


More to come. Find me on #k162space on tweetfleet.slack.com.
spotmarket on Github
Posted: 2016-01-22 Filed under: python, spotmarket | Tags: d3js, jita, venal Leave a commentinitial commit
I published the initial code to GitHub with install directions for Ubuntu. The project so far is a Python script that consumes map API jump and kill activity and inserts them into a PostgreSQL database. Details as to why I picked these two items as starting points to come later.
https://github.com/brentnowak/spotmarket
So far this has been a fun learning project; I’m getting more familiar with Python datatypes/iterators/quirks, have been leveraging arrow for any datetime work, am getting more comfortable with pandas, and have a handle on the basic differences between MySQL and PostgreSQL.
Growing Laundry List
- Frontend – The previous project was written in a PHP framework and I have some basic JavaScript under my belt, but I am historically more of a backend/server focused person so web presentation is a weakness of mine. Django has been mentioned to me so perhaps I will do some research.
- Implement more efficient UPSERT to improve database insertion efficiency.
- Figure out what CREST market data to record.
- Start working on putting the pieces together for the first analysis — more on that later.
Screenshots
Jita Jumps

Presenting data with Python Pandas.

Manually extracting the data to a csv and charting it in D3.js for now.

spotmarket Prototyping
Posted: 2016-01-17 Filed under: python, spotmarket | Tags: amd, asus, mysql, postgresql, tweetfleet Leave a commentThe past few months have been a series of shifting goals and commitments for me, both personally and professionally. I’ve spent more time outside running trails in the Marin Headlands and I changed jobs, landing a engineering role at a trading firm.
The winter months in San Francisco mean rain, and as such, I have been spending a lot of time reading Python tutorials, collaborating with James and Greg at element43, and working on a list of design requirements for the spotmarket trading platform.
The biggest addition to the project has been the buildout of a proper homelab server running ESXi. I’ve wanted to build out a homelab since I’m a network engineer and often tinker, but I’ve never really had a driver for the project. For the odd virtual machine or instance of a virtual switch/router that I’ve needed, I’ve leveraged an install of Oracle VirtualBox on my desktop. Now that I want to run development, production, and other testing machines, I built out a server.
Server ‘esx-01’, Uninspired Name
I ended up running ESXi 5.5 because I struggled to get my ‘unsupported’ NIC to work in 6.0. I followed a few guides to load drivers into the installation ISO, but was unable to get the setup procedure to complete properly for 6.0. My needs are basic on the VMware end so I’m sticking with 5.5 as I was able to get that to install with Realtek 8168 onboard NIC.
Details for the build:
- ASUS M5A99FX PRO R2.0 Motherboard
- AMD FX-8320 Vishera 8-Core 3.5 GHz CPU
- SanDisk Ultra II 2.5″ 480GB SSD
- G.SKILL Ripjaws X Series 16GB (2 x 8GB)


Python Learning
I was in a computer engineering program for two years in college before switching over and finishing in a telecommunications program. During that time I was exposed to assembly, C, and C++. I spent many late nights struggling with those languages, so I was apprehensive to dive back into programming.
I picked Python as the main language for this project and so far it has been outstanding. I’m getting more comfortable with the Python datatypes, iterators, and reliance on indentation. For data manipulation I’m using pandas, which for anyone that loves rows and columned data, it is second nature.

Another item that has taken a lot of brain time has been the switch from MySQL to PostgreSQL. I’ve had to learn about the use of schemas, differences in data types, how to enable TCP access, and migrate my administration/query generator tool over to pgAdmin.
The Chats
If you have any comments or want to chat with me, find me on the new #k192space channel at tweetfleet.slack.com. Upcoming posts will delve into coding and talk about the reporting that I’ve started to build.
