
spotmarket – pivot and resample
Posted: 2016-01-29 Filed under: market, python, spotmarket | Tags: blood raiders, cloud ring, delve, fade, fountain, outer ring, period basis, querious, serpentis, syndicate Leave a commentOverview
I published v0.2, which includes a bunch of hacked together proof of concept code. This week I dove into the pandas library, focusing on the data manipulation tools that are inherit to pandas. This post covers some of the highlights and demonstrates the initial charting that I’ve been producing.
More to come on what I plan to do with the data; for now those details have to be a trade secret.
Data Frame
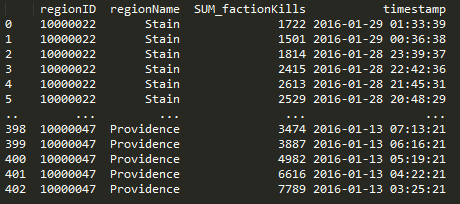
The crux of pandas is the dataframe and this week I discoverd that you can load your query results right into a dataframe and not have to write a parser. Notice in the below code that I run the query and place the results into a dataframe with a ‘fetchall()’. This really saves me a lot of headaches when passing around chunks of data and makes it easy to write functions to combine data with overlapping values. Return the dataframe and do more ::work::.
Here’s a query that I use to get NPC kills by region when given a regionID.
def getnpckills_byregion(regionID):
    conn = psycopg2.connect(conn_string)
    cursor = conn.cursor()
    sql = """SELECT
      "mapSolarSystems"."regionID",
      "mapRegions"."regionName",
    SUM(mapkills."factionKills") as SUM_factionKills,
      mapkills."timestamp"
    FROM
      data.mapkills,
      public."mapRegions",
      public."mapSolarSystems"
    WHERE
      "mapRegions"."regionID" = "mapSolarSystems"."regionID" AND
      "mapSolarSystems"."solarSystemID" = mapkills."solarSystemID" AND
      public."mapSolarSystems"."regionID" = %s
    GROUP BY mapkills."timestamp", public."mapSolarSystems"."regionID", "mapRegions"."regionName"
    ORDER BY timestamp DESC
    """
    data = (regionID, )
    cursor.execute(sql, data)
    df = pd.DataFrame(cursor.fetchall(),columns=['regionID', 'regionName', 'SUM_factionKills', 'timestamp'])
    cursor.close()
    return df
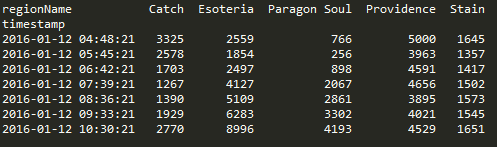
Pivot
Doing a pivot in pandas is amazingly elegant and you can perform the operation in one statement.
df.pivot(index='timestamp', columns='regionName', values='SUM_factionKills')
Resample
Another powerful tool in the library are the resampling options. I’m still trying adjusting the parameters to find a balance on data granularity.
The below graphs show NPC kills over all regions over time. One graph has no resampling while the other has values that I feel display a daily value, normalizing the peaks and valleys that occur due to server downtime and differing activity rates due to timezone.
conversion = "12H"
v_window = 8
v_minperiods = 1
pd.rolling_mean(df.resample(conversion, fill_method='bfill'), window=v_window, min_periods=v_minperiods)


Results
Ratting activity in Blood Raiders regions:


Ratting activity in Serpentis regions:


More to come. Find me on #k162space on tweetfleet.slack.com.
Phobos Roam
Posted: 2011-11-16 Filed under: ships | Tags: bubble, heavy interdictor, nullsec, phobos, roam, syndicate, thorax Leave a commentLast night I went on a roam into Syndicate with the Alliance.
Heavy Interdictors are a new class for me and I was sure to tell the FC that it was my first time out in the ship. I relied on his direction for bubble placement and up/down activations. There is a certain elegance in placing bubbles to catch incoming our outgoing traffic. You want to be able to trap while allowing your fellow Blues to engage.
It’s a learning experience but even in the hour roam that we were on, I learned a lot. The first thing I noticed is how much longer it takes me to align and get into warp compared to our fellow Drake and Hurricane pilots. This 1600 weighted beast sure takes its time.


I’m open to any tips from fellow Heavy Interdictor pilots and perhaps catching you in a bubble Soon(tm)!
