
spotmarket Graph Sample
Posted: 2016-06-07 Filed under: nullsec, pvp, python, spotmarket | Tags: amarr, branch, deklein, dodixie, fade, guristas, jita, pure blind, rens, tenal, the forge, tribute, venal Leave a commentWhat’s data without some graphs? Here is a small snip of the graphing that is currently in the spotmarket project.
Data
Jumps
2016-01-13 to 2016-06-07
17,802,640 Rows
Kill
2016-01-13 to 2016-06-07
9,819,421 Rows
Graphs
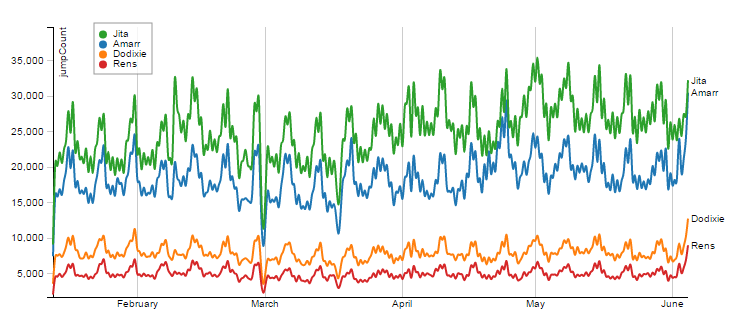
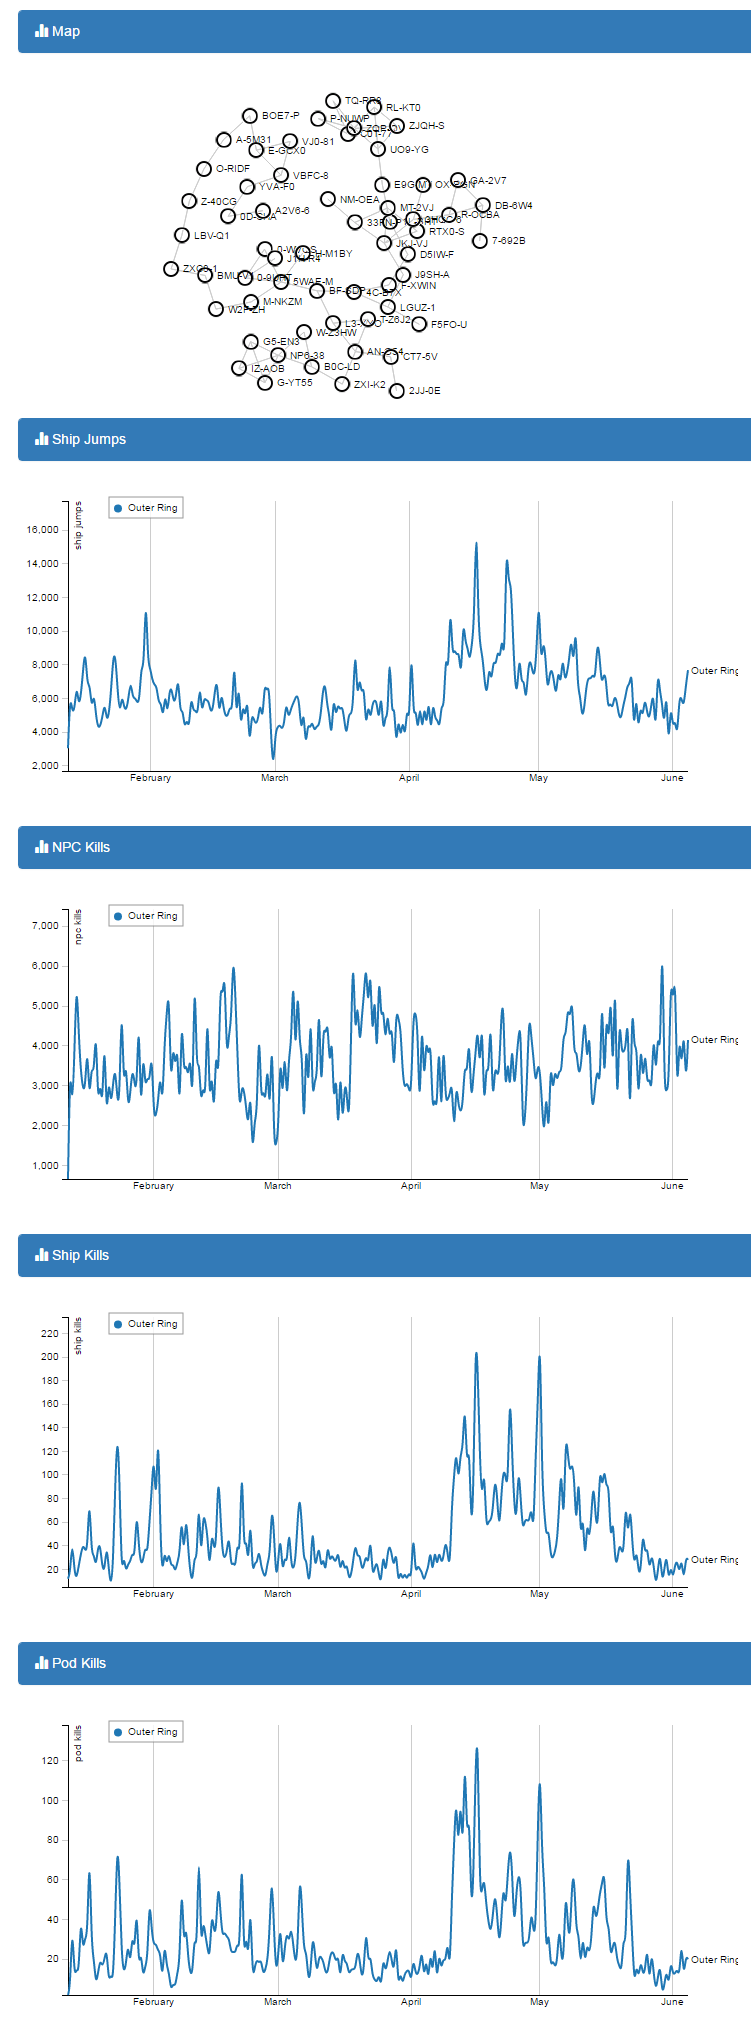
Jumps in Trade Hubs
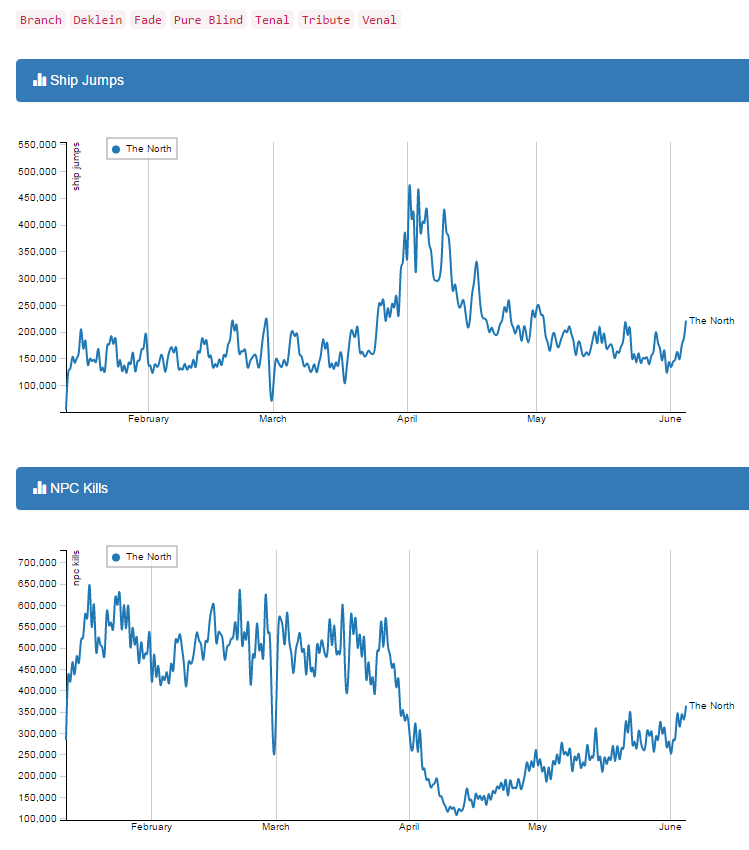
Jumps and NPC Activity in The Northern Regions
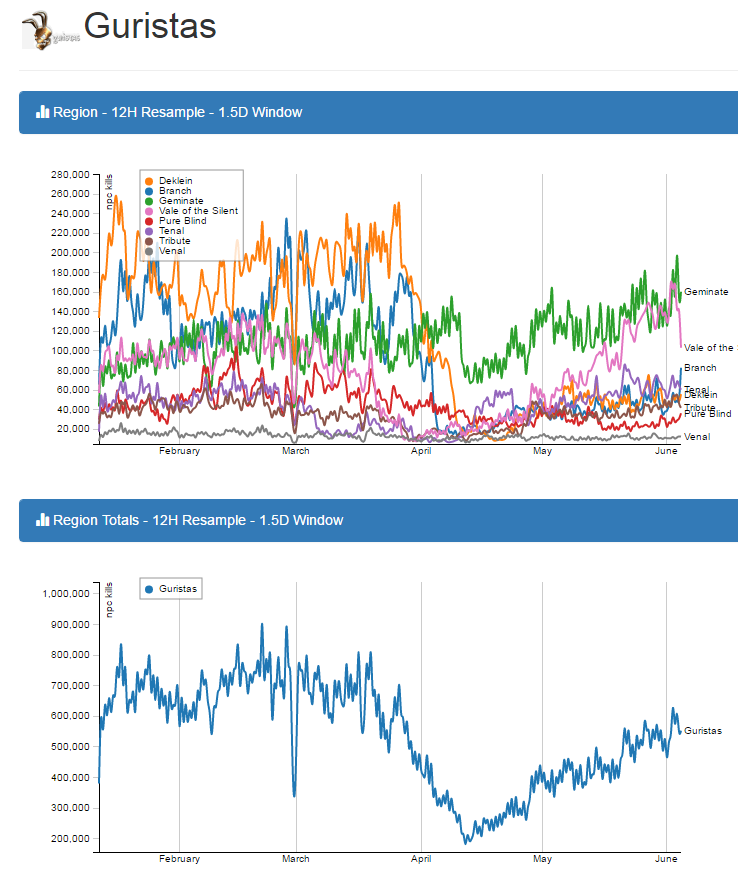
Gurista Ratting Rates
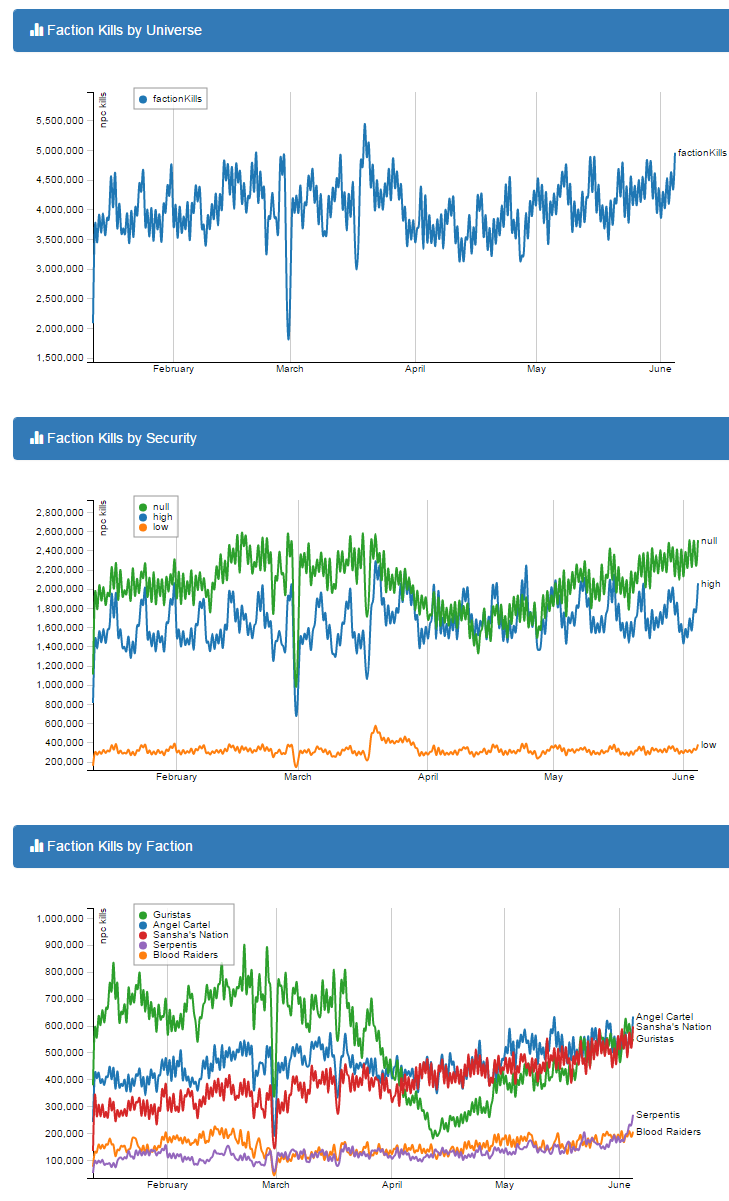
NPC Universe Overview
Outer Ring
First pass at a map using D3.js inspired by HelicityBoson at http://www.machine9.net/?p=1111.
Initial Ranking of Top Manufacturing Regions
Posted: 2014-07-24 Filed under: industry | Tags: crius, domain, essence, heimatar, kador, lonetreck, metropolis, sinq laison, tash-murkon, the citadel, the forge 1 CommentWith manufacturing data now being exposed over the new CREST API at http://public-crest.eveonline.com/, I spend some time working with the data to see how the initial layout of the land is on the first day of the new Crius expansion.
As expected the top ten regions for manufacturing are in Highsec with the outlaying regions of nullsec barely producing anything at the moment. I’ll be monitoring changes to if things shakeup.
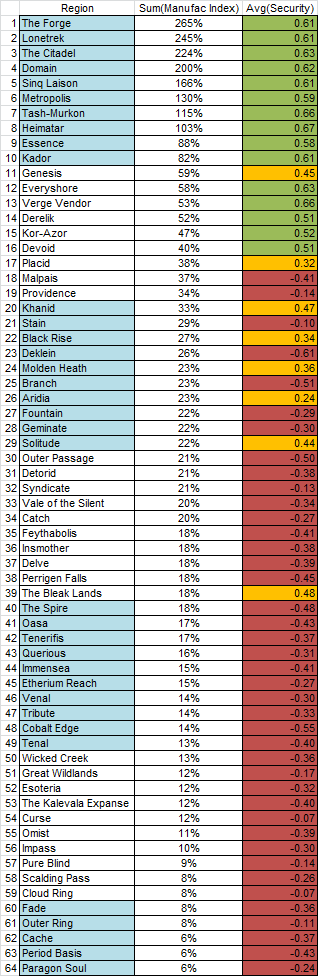
Focusing on the top 40 systems shows that the majority are in The Forge, Lonetrek, and The Citadel.

Capital Runs 1-229 (Final)
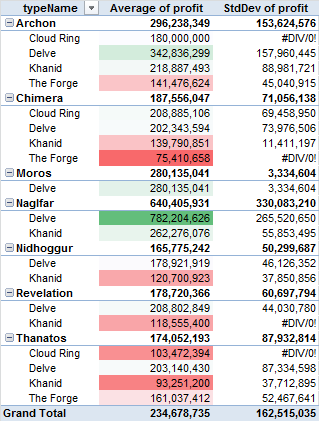
Posted: 2014-06-05 Filed under: industry, market | Tags: archon, chimera, cloud ring, delve, khanid, moros, naglfar, nidhoggur, revelation, thanatos, the forge 2 CommentsOverview
Is is more profitable to build a Carrier from BPCs or BPOs? That question was the initial spark that started my interest in capital production in 2011. Using a BPC copy pack from the market was hardly profitable so I made a plan to own and operate a set of capital BPOs.
Over time as profits started to materialize, more BPOs were purchased to round out production queues. Carrier success then started to bleed into Dreadnought production. With the upcoming industry changes in the Crius expansion, the fate of my capital operation is unknown so I have paused the project.
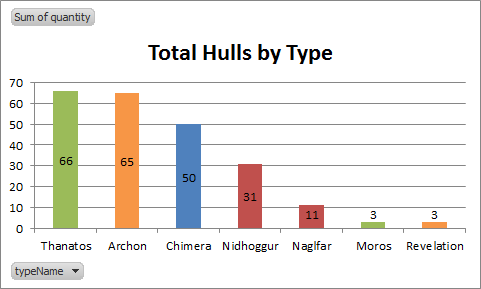
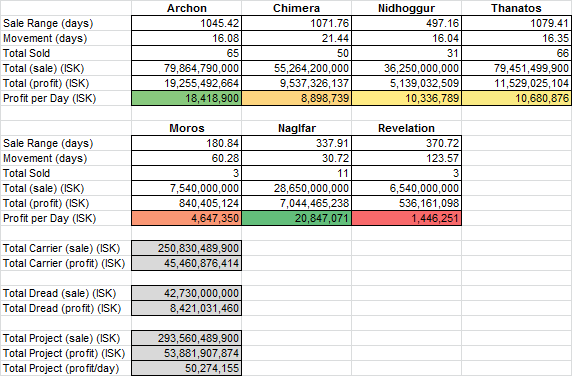
Here are the final numbers for almost 3 years (2.93 to be exact) of capital production. Note that Dreadnought production was a recent addition, only starting in mid-2013. Special tribute goes to my industry partner, Raath, as he was the lead on this massive project.
tl;dr Build Naglfars and Archons.
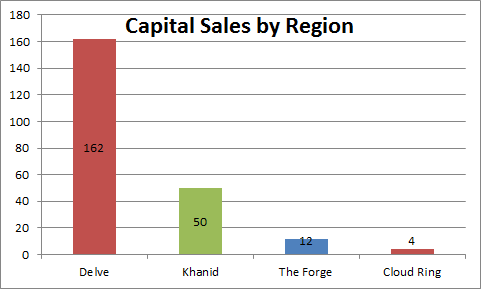
Sales
Performance
Naglfar sales in Delve outperformed all other types and regions yet showed the most standard deviation.
The Naglfar outperformed every other hull type when it came to profitability per time period. This is due to the balance update it received in the Odyssey update where it became a viable doctrine ship. The Archon, due to the popularity of the Slowcat doctrine, was also solid performer.
Visualization of Technetium and Cobalt Moon Concentrations
Posted: 2013-01-10 Filed under: eveonline, industry, market, nullsec | Tags: cobalt, technetium, the citadel, the forge 8 CommentsOverview
We always hear that “Technetium is concentrated in the North”. I wanted to use data that I have to visually show this concentration to further prove that claim. Additionally I want to show how different the concentrations of Cobalt is when compared to Technetium. Cobalt is of particular interest as it became a recent star due to changes in alchemy in order to impact the rising cost of Technetium.
The Data
I have been developing a database of moons and their associated minerals. This dataset was born out of frustration when I used to help my corporation perform reactions in the Pure Blind and Cloud Ring regions. Often our logistics crew was doing double survey work so I started a centralized point of information to hold our moon data.
My coverage is small and has many inaccuracies; I have coverage on 32,000 moons at this point, which only covers 22.31% of Eve’s 143,402 Lowsec and Nullsec moons. I’m sure that there are some gross errors as I have pieced this data from various public and private sources. Alliances and reaction-heavy Corporations tend to guard their moon data very closely, so I’ve have limited exposure to verified and sanitized data.
Moon Coverage
My coverage of Technetium is 275 moons with an estimated 360-450 in existence. Using a conservative guess of around 400, that give me an estimated 68% coverage with a large amount of error.
The dataset on Cobalt is higher, coming in at 2,702 moons. I don’t have an estimation on how many there are in existence, so I can’t judge my coverage.
Despite the inaccuracies of my dataset, it can still be used to produce a scatter plot of the Eve Universe. I’ve added The Forge and The Citadel for map orientation purposes.
[Jan 10 Update]
From the comments so far, a lot of people are having trouble with the scatter plot. It is a 2D map of the Eve Unvierse with dots for systems that contain that moon type or are of that region. I thought that adding The Citadel and The Forge would help clarify the orientation of the map. Keep the Verite Influence map in mind when looking at these plots.
Technetium


Cobalt


