
Spreadsheets in Space
Posted: 2013-03-13 Filed under: eveonline, industry, market | Tags: anshar, aurora, bpc, bpo, carrier, pos, scorch, spreadsheet 11 CommentsMy side interest in information aesthetics is present in my work, both professional and personal. I’ve received many comments on how clean and clear my analysis charts, reports, and spreadsheet work can be so I though I would share some of my Eve related spreadsheet work to inspire people.
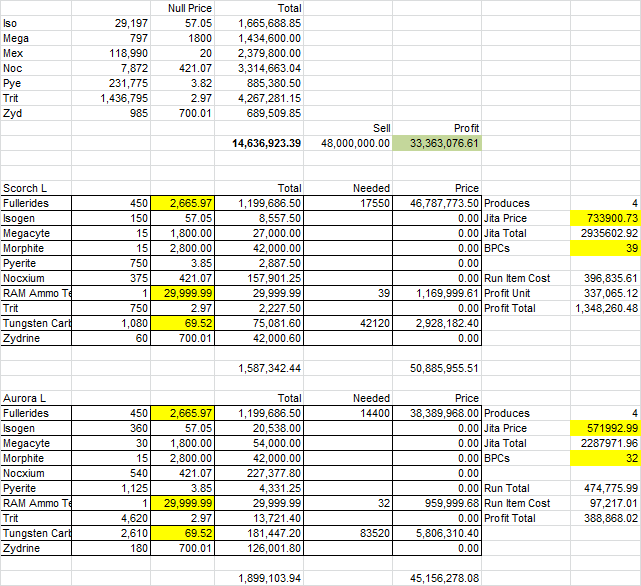
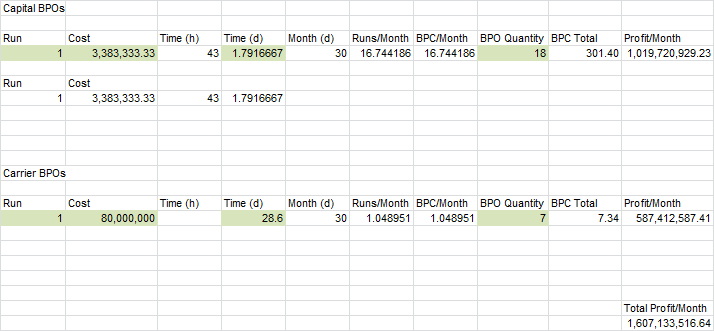
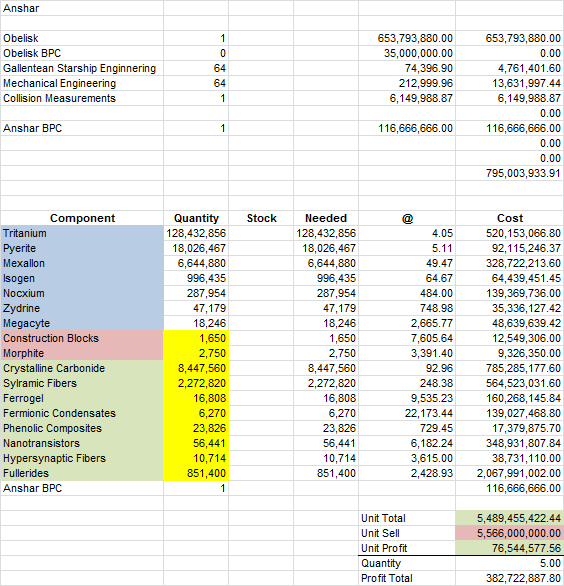
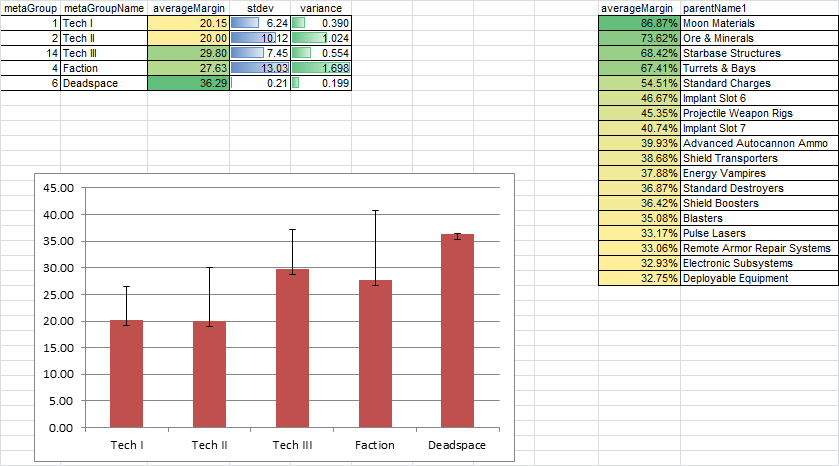
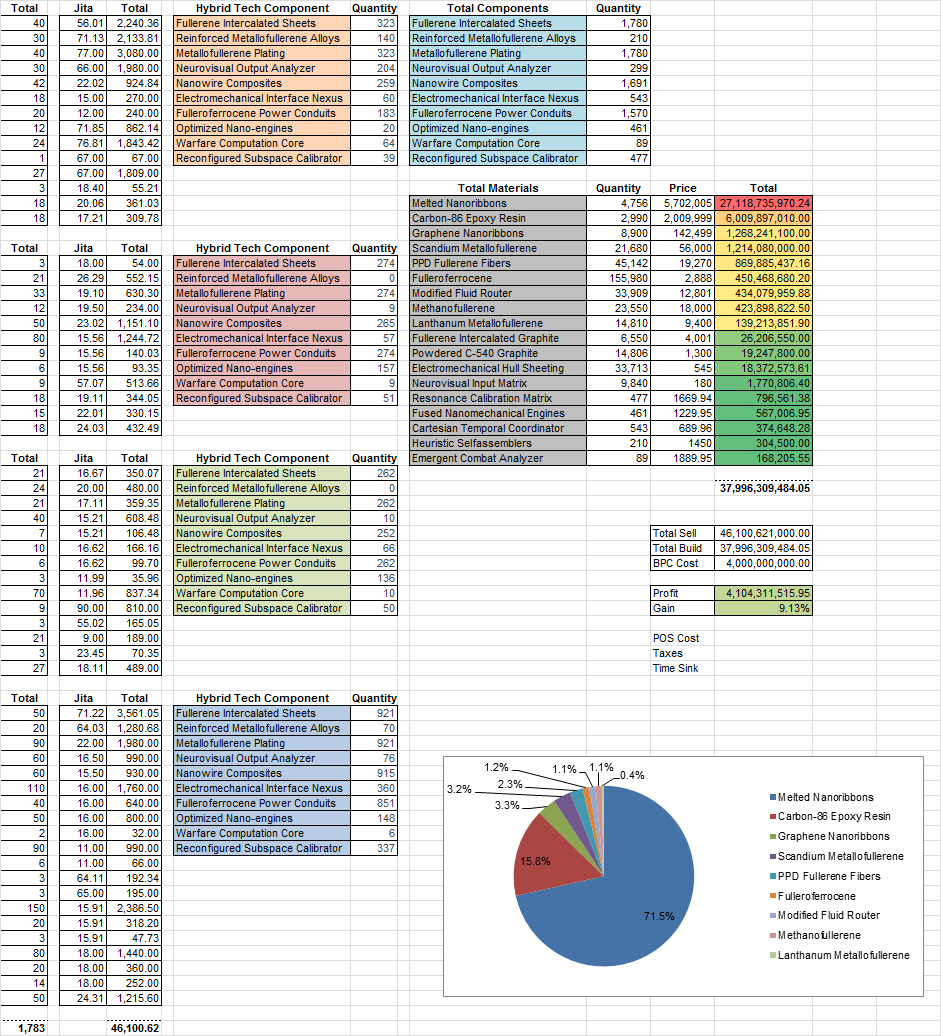
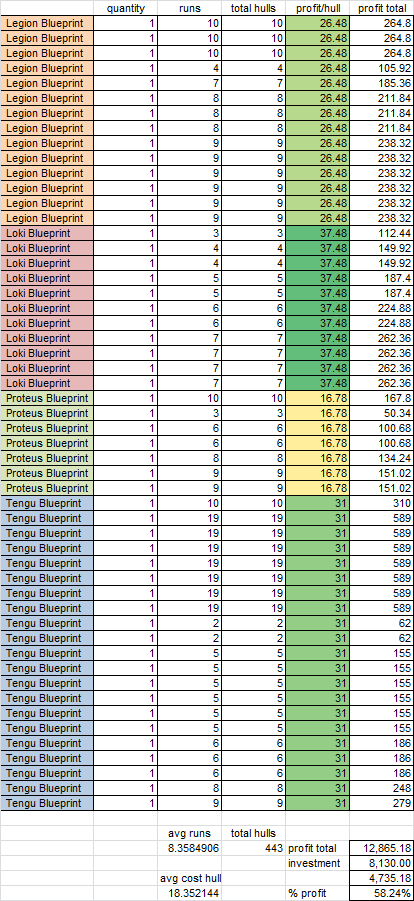
Here are screenshots from depreciated spreadsheets that I used for industrial production, speculation, and fuel estimations before switching to a custom web-based solution that my partner, Raath, created.
My design goal has always been to use small type-face Arial text that is boxed and columned with important information highlighted in primary colors or shaded in gradients to denote best to worst status. Some of these sheets are old with broken formulas or outdated build requirements. Pay more attention to the organization rather than to the numerical content.
Ammo

Compression

Copy BPOs
Copy Capital BPOs

Freighter Construction
Jump Freighter Construction
Margins
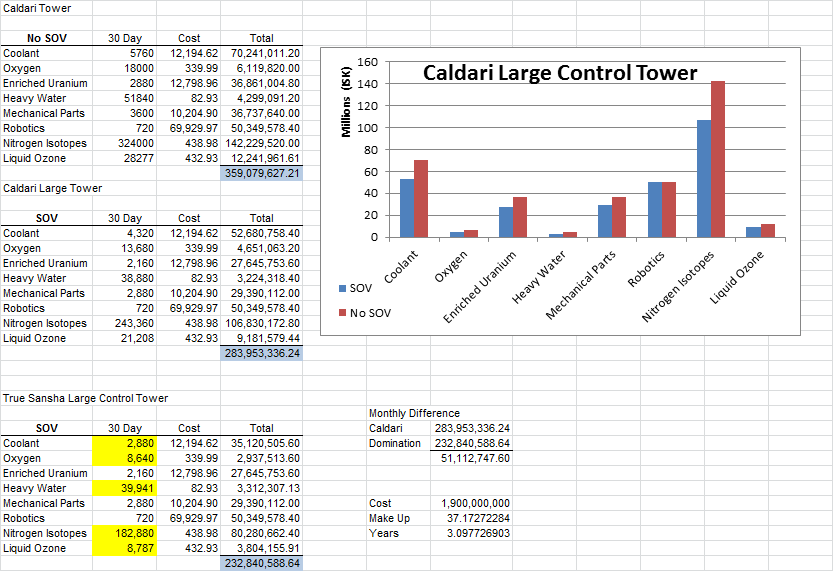
POS Fuel
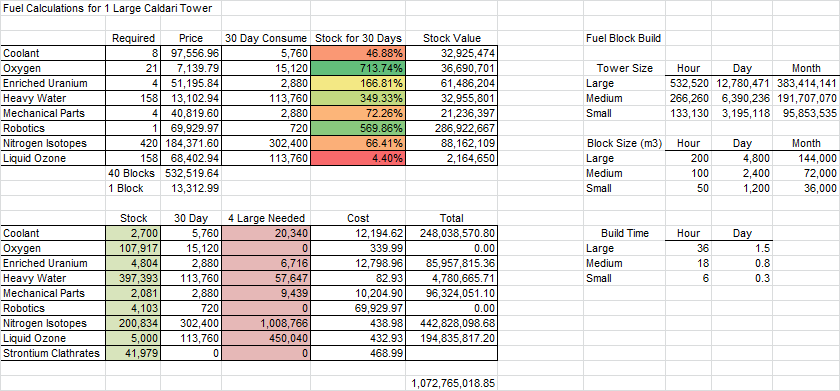
POS Fuel Blocks
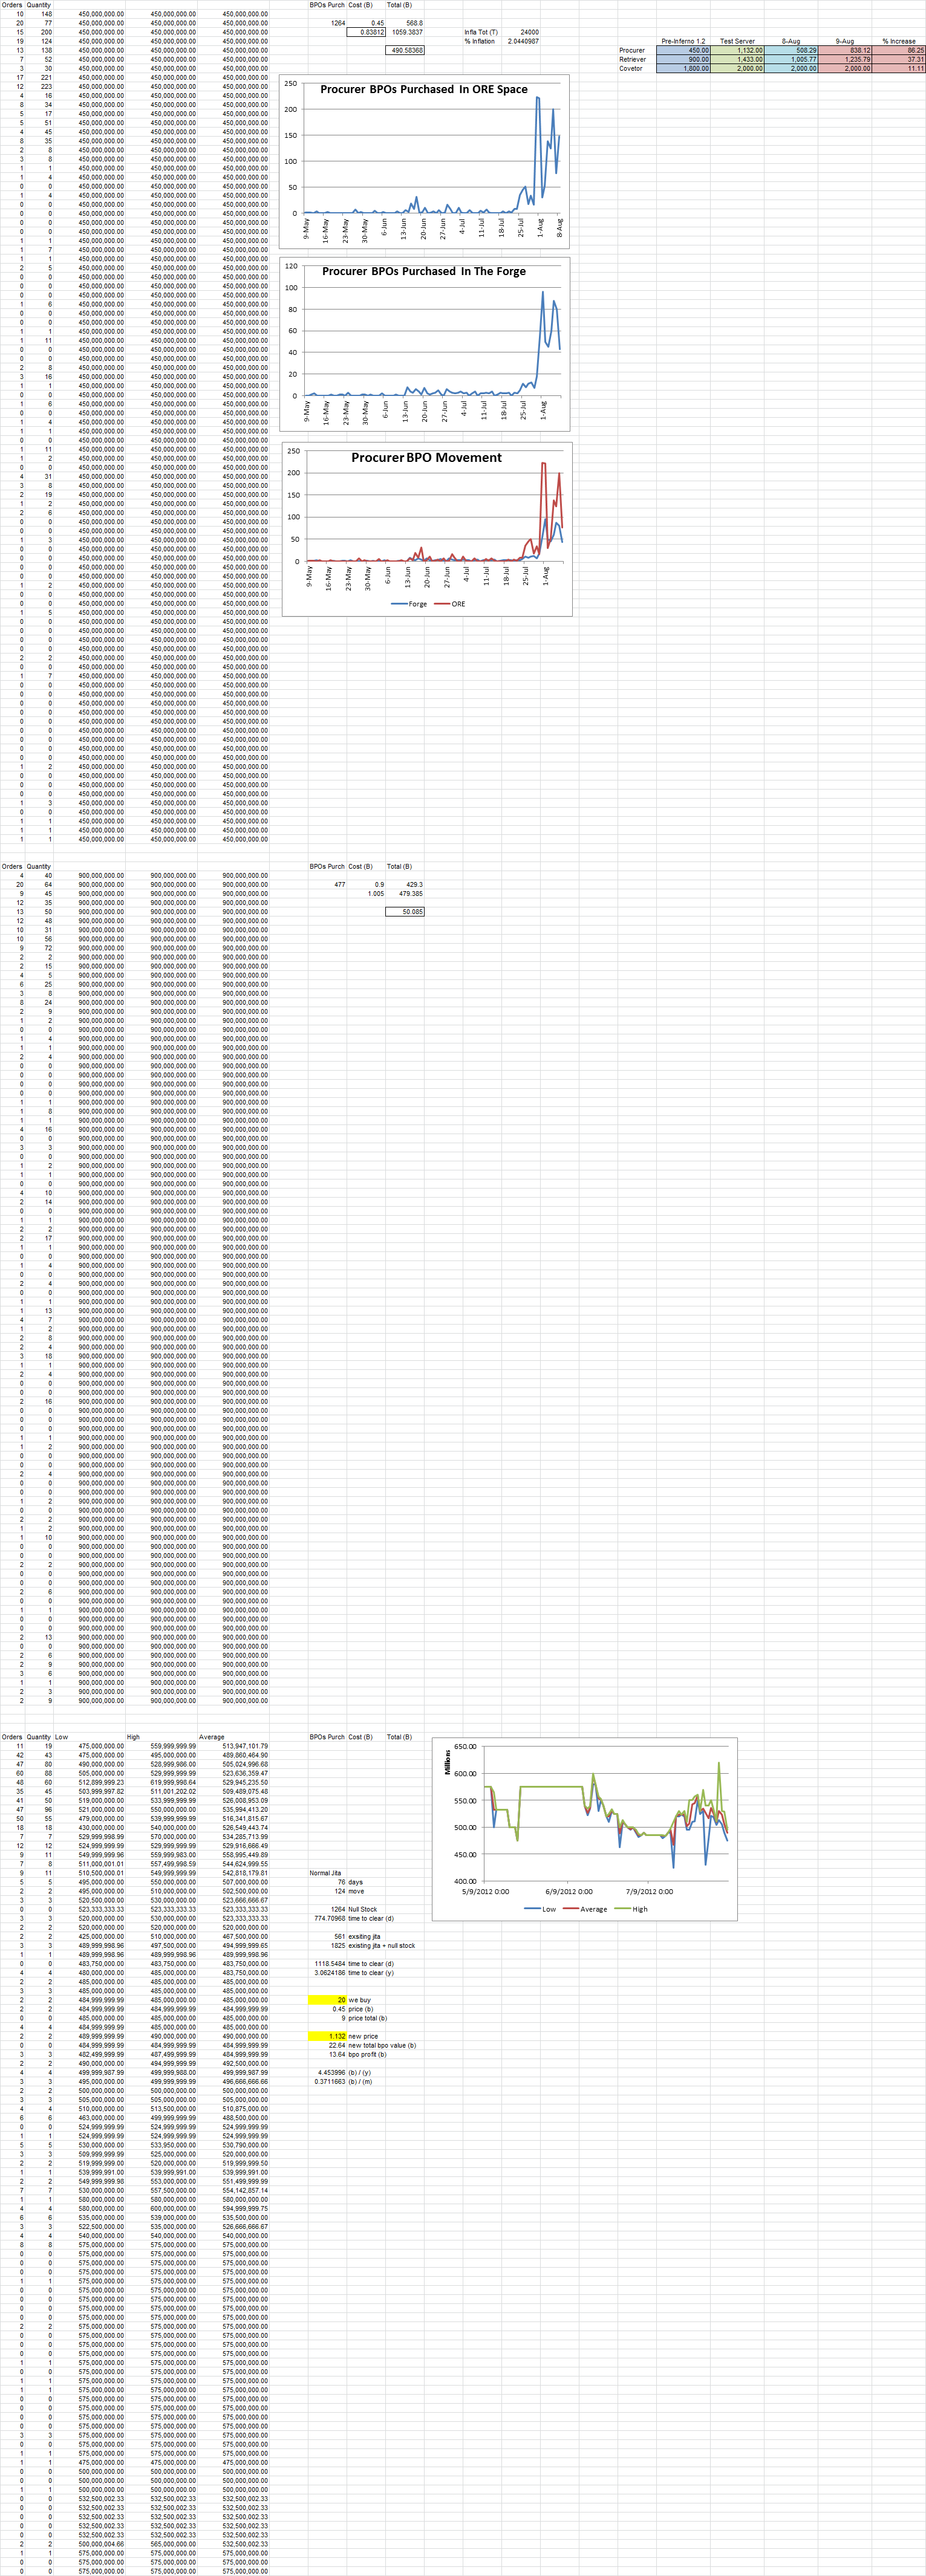
Procurer Speculation
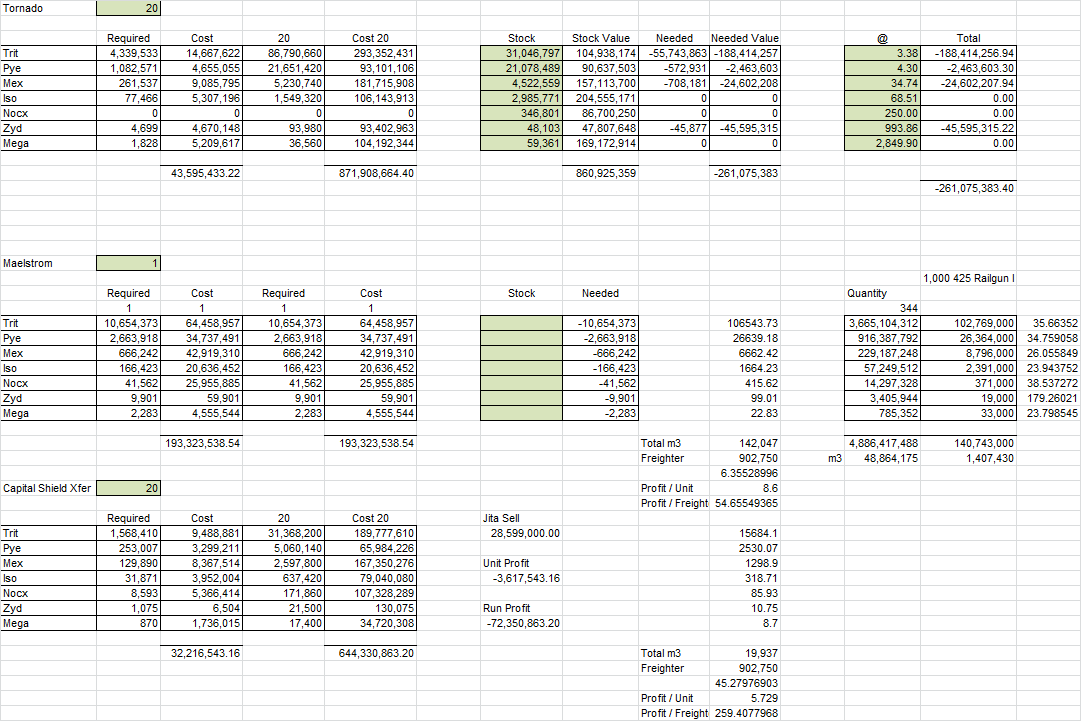
Ship Construction
T3 Subsystem Construction
T3 Hull Construction
Nullsec Alliance Data Transformation
Posted: 2011-09-21 Filed under: eveonline | Tags: alliances, csv, data, excel, mysql, nullsec, pivottable, RipardTeg, spreadsheet 1 CommentMessy numbers to some, or a wealth of information for others. Here is a quick rundown of how I processed the data to form the Nullsec Alliance Growth and Decline post.
1. Get raw data from Wollari at Dotlan.
allianceID,date,members
151380924,26.06.2007,622
166439722,26.06.2007,1130
284278305,26.06.2007,252
288377808,26.06.2007,1151
386292982,26.06.2007,412
477769446,26.06.2007,252
628991027,26.06.2007,1062
632866070,26.06.2007,2267
673381830,26.06.2007,416
2. Load Eve Alliance information via API into a table.
![]()
3. Import Dotlan data into MySQL table and join allianceID on both tables to generate more human friendly data set that includes Alliance Names and Tickets.
SELECT alliances.allianceID, alliances.name, alliances.shortName, date, members
FROM allianceHistory, alliances
WHERE alliances.allianceID = allianceHistory.allianceID

4. Export data into an Excel readable file.
I spent some time debating about working with this data using a MySQL table and a charting engine such as Highcharts, but settled on using an Excel PivotTable. The time involved with me tinkering with the JavaScript (not my most proficient programming language) would really hinder progress.
Once in Excel, I had to reformat the date from dd.mm.yyyy to yyyy-mm-dd to allow proper chart generation. First, I used the text to column feature with a comma ‘,’ set as the deliminator. Secondly, in a new column, I used a formula to combine the date in my desired format.
=DATEVALUE(F1&"-"&E1&"-"&D1)

Hide the D, E, and F columns and we’re got a good set of data to analyze.
5. Select all 87,543 rows and generate a PivotTable using the Alliance Name as the legend, date as the Axis Fields, and a summation of the Member Count as the Value.
Now the fun part is thinking of WHAT is significant.

Some of the first things that I wanted to show was the rise and fall of the NC, growth of the DRF, and some charting for the larger Alliances like Goons and Test. These charts can be seen in the original post linked at the top.
RipardTeg of Jester’s Trek came to me with idea for a new report that I think will prove rather interesting. I’m going to be working with him to answer the question of ‘whether small sov-holding null-sec alliances are surviving in the last two years, or being folded into the mega-alliances over time’.
This type of Eve Community collaboration with passionate, exemplary individuals is what really keeps me playing. Stay tuned.
