Historical Trading Performance Numbers
Posted: 2013-02-08 Filed under: industry, market | Tags: isk, pandemic legion, test 4 CommentsHaving seen TEST’s and Pandemic Legion’s Finance Report, I was inspired to pull up and analyse my own performance numbers to see how I compare to the income streams of larger alliances.
A few MySQL queries and a Pivot Table later, I have some performance numbers for 2010-2012. Turns out I have an average of 2.33% the income of Pandemic Legion.
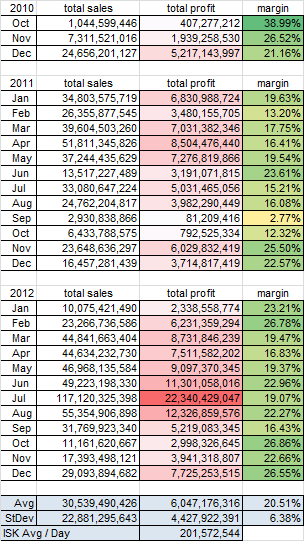
September through October of 2011 was a period where I lost faith in CCP’s ability to deliver new and inspiring content. That lack of interest was directly shown in these performance numbers as I stopped logging into the game.
Trading Performance: Battlecruisers
Posted: 2013-02-07 Filed under: eveonline, industry, market, ships | Tags: drake, hurricane, naga, oracle, talos, tornado 2 CommentsOverview
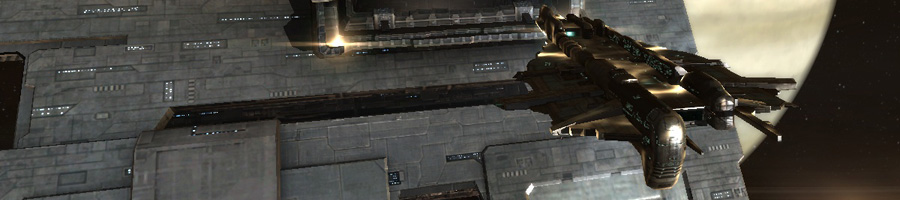
Given the shakeup coming with the tiericide effort, Armor tanking, and the sweeping changes coming this summer, I feel comfortable disclosing performance numbers for production and trade involving popular Battlecruisers hulls.
Analysis
The Drake and Hurricane market has been and continues to be a very competitive market. I contribute this to a few factors.
First there are many industrial people that will not consider the time it takes for them to mine minerals; remember that time is money and the hours that you spend slaving away staring at a rock for a few million an hour could be better spent doing more lucrative activities. Note that this point is not isolated to these hulls and is a common error in production logic for new industrialists.
The PVP and PVE proficiency of the Drake makes it a very popular ship. There will always be a large draw for industry people to focus on this hull, making for high competition.
Lastly, given the time that these two ships have been in the game, many industrialists have these BPOs researched to high levels and have had them for many years.
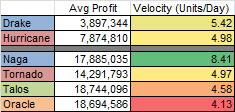
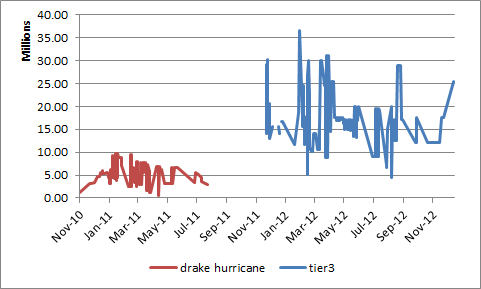
My production and trade focus shifted off of the Drake and Hurricane when the Tier 3 Battlecruisers were introduced as I saw a high demand for them in the PVP arena.
As you can see the trading performance below, they have proven to be far more profitable on average than their older counterparts.
tl;dr
Make Naga, Oracle, Talos, and Tornado hulls not Drake and Hurricane ones.
Visualization of Moon Mineral Concentrations
Posted: 2013-01-30 Filed under: industry, market, nullsec | Tags: atmosphere gases, cadmium, ceasium, chromium, cobalt, dysprosium, evaporite deposits, hafnium, hydrocarbons, mercury, neodymium, platinum, promethium, scandium, silicates, technetium, thulium, titanium, tungsten, vanadium 5 CommentsOverview
In a previous post, I detailed the concentration of Technetium and Cobalt moon locations because they are of particular political interest due to their distribution and the recent rework of the Alchemy reaction for Platinum Technite.
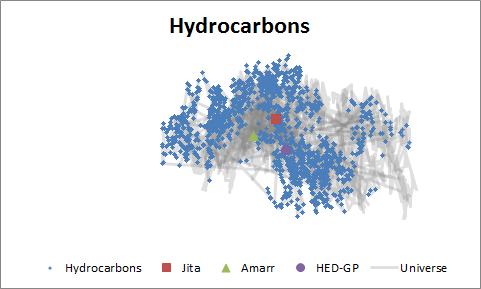
Now I wanted to use my entire dataset to plot out all moon minerals to see if there was any pattern or promise of future monopolistic cartels due to the geographical distribution of the moon minerals.
Data
My dataset contains information on 32,162 moons with a lack of data for Evaporite Deposits; I don’t consider this alarming to my analysis as it is a very common moon mineral.
Since my master dataset was pieced together from a few independent sources, I am not surprised by the inaccuracies or missing data points. As I have stated before, sanitized moon scanning data is usually a closely guarded piece of information by large Alliances and Industrial corporations as a large amount of time and energy has been spent gathering the data.

The raw numbers show that I have very poor coverage in many regions, but we need to consider that not every moon contains a mineral. If I knew the density of moon minerals (how many received minerals versus not in the seeding process), I could get a better feeling of my coverage levels. For now just consider the Green regions having a strong coverage and the Red regions showing poor coverage; ignore the coverage percentage values.
Despite the alarming Red portions that indicate major holes in my dataset, we can see interesting visual results from the initial galaxy seeding process. These seeding trends can help us explain the prices of certain minerals given their location, political atmosphere around specific areas, and weight necessity in the Tech2 production chain. *cough* Technetium *cough*.

Rarity 2
The low value of these types of minerals is due to the sheer amount and distribution of each type. These common minerals are contained in almost every region.


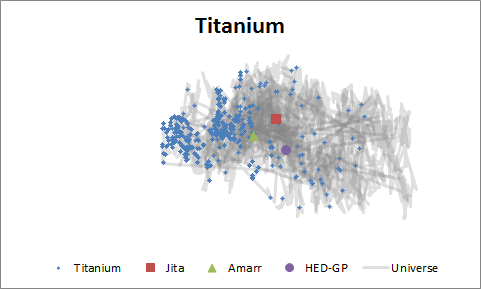
Rarity 8
With these types, we can see a definite skew in the regional location of each type. There are major pockets with a small scattering around the universe.


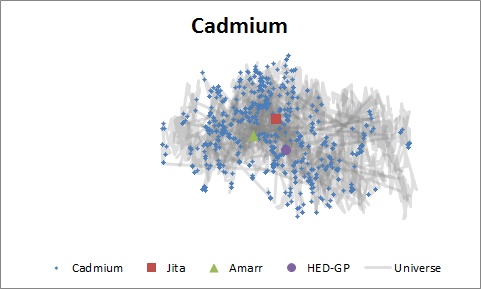
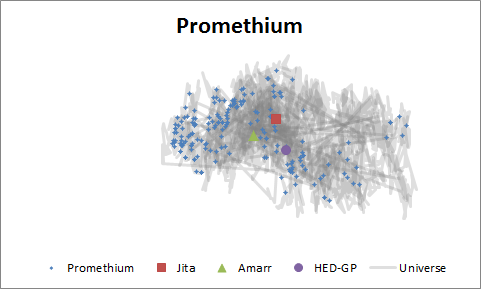
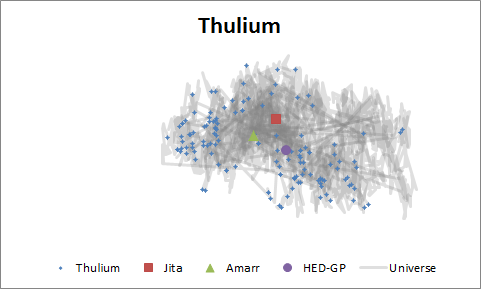
Rarity 16
With the Rarity 16 minerals, there seems to be an even spread across the universe with no major points of concentration.


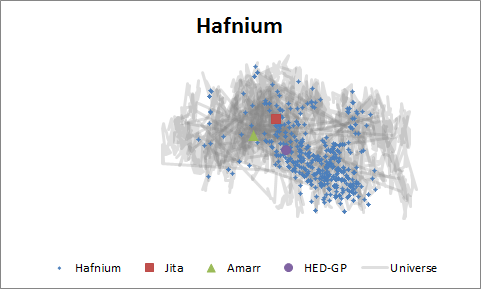
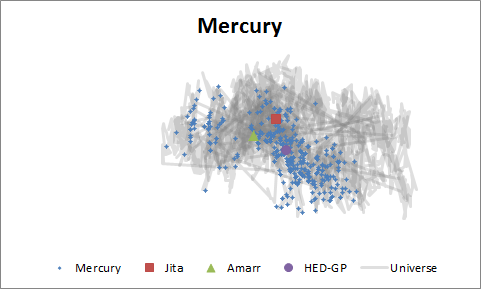
Rarity 32
With these moons it seems like each type is dominant in a specific quadrant of the universe. Ceasium in the West, Hafnium in the South, Mercury also in the South, and Technetium having the majority of its concentration located in the North.


Rarity 64
The rarity of these moons is shown with the lack of points on the scatter plot. We can see that they are spread around the Universe, but the lack of quantity keeps each type rare.


Trading Performance: Ammo
Posted: 2013-01-29 Filed under: eveonline, industry, market | Tags: antimatter, barrage, caldari navy, fusion, hail, multifrequency, phased plasma, quake, republic fleet, scorch 2 CommentsOverview
I’ve stated in a few monthly or end of year reports that I’ve had limited success with ammo. I made some database queries and went over my historical trading data to evaluate ammo trading performance.
Market Group Stats
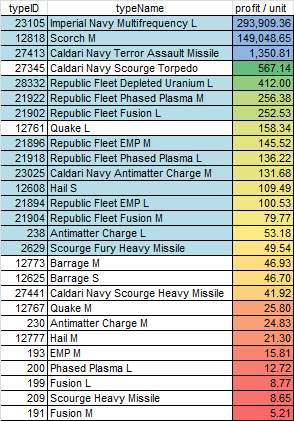
45.481 M units sold, profit of 2.382 B, and average profit/unit of 16,556 ISK.
Analysis
From this analysis you can see that working with Faction ammo and certain Tech 2 ammo types are the most profitable. I’ve highlighted the ones that I would continue to work in a blueish shade.
Visualization of Technetium and Cobalt Moon Concentrations
Posted: 2013-01-10 Filed under: eveonline, industry, market, nullsec | Tags: cobalt, technetium, the citadel, the forge 8 CommentsOverview
We always hear that “Technetium is concentrated in the North”. I wanted to use data that I have to visually show this concentration to further prove that claim. Additionally I want to show how different the concentrations of Cobalt is when compared to Technetium. Cobalt is of particular interest as it became a recent star due to changes in alchemy in order to impact the rising cost of Technetium.
The Data
I have been developing a database of moons and their associated minerals. This dataset was born out of frustration when I used to help my corporation perform reactions in the Pure Blind and Cloud Ring regions. Often our logistics crew was doing double survey work so I started a centralized point of information to hold our moon data.
My coverage is small and has many inaccuracies; I have coverage on 32,000 moons at this point, which only covers 22.31% of Eve’s 143,402 Lowsec and Nullsec moons. I’m sure that there are some gross errors as I have pieced this data from various public and private sources. Alliances and reaction-heavy Corporations tend to guard their moon data very closely, so I’ve have limited exposure to verified and sanitized data.
Moon Coverage
My coverage of Technetium is 275 moons with an estimated 360-450 in existence. Using a conservative guess of around 400, that give me an estimated 68% coverage with a large amount of error.
The dataset on Cobalt is higher, coming in at 2,702 moons. I don’t have an estimation on how many there are in existence, so I can’t judge my coverage.
Despite the inaccuracies of my dataset, it can still be used to produce a scatter plot of the Eve Universe. I’ve added The Forge and The Citadel for map orientation purposes.
[Jan 10 Update]
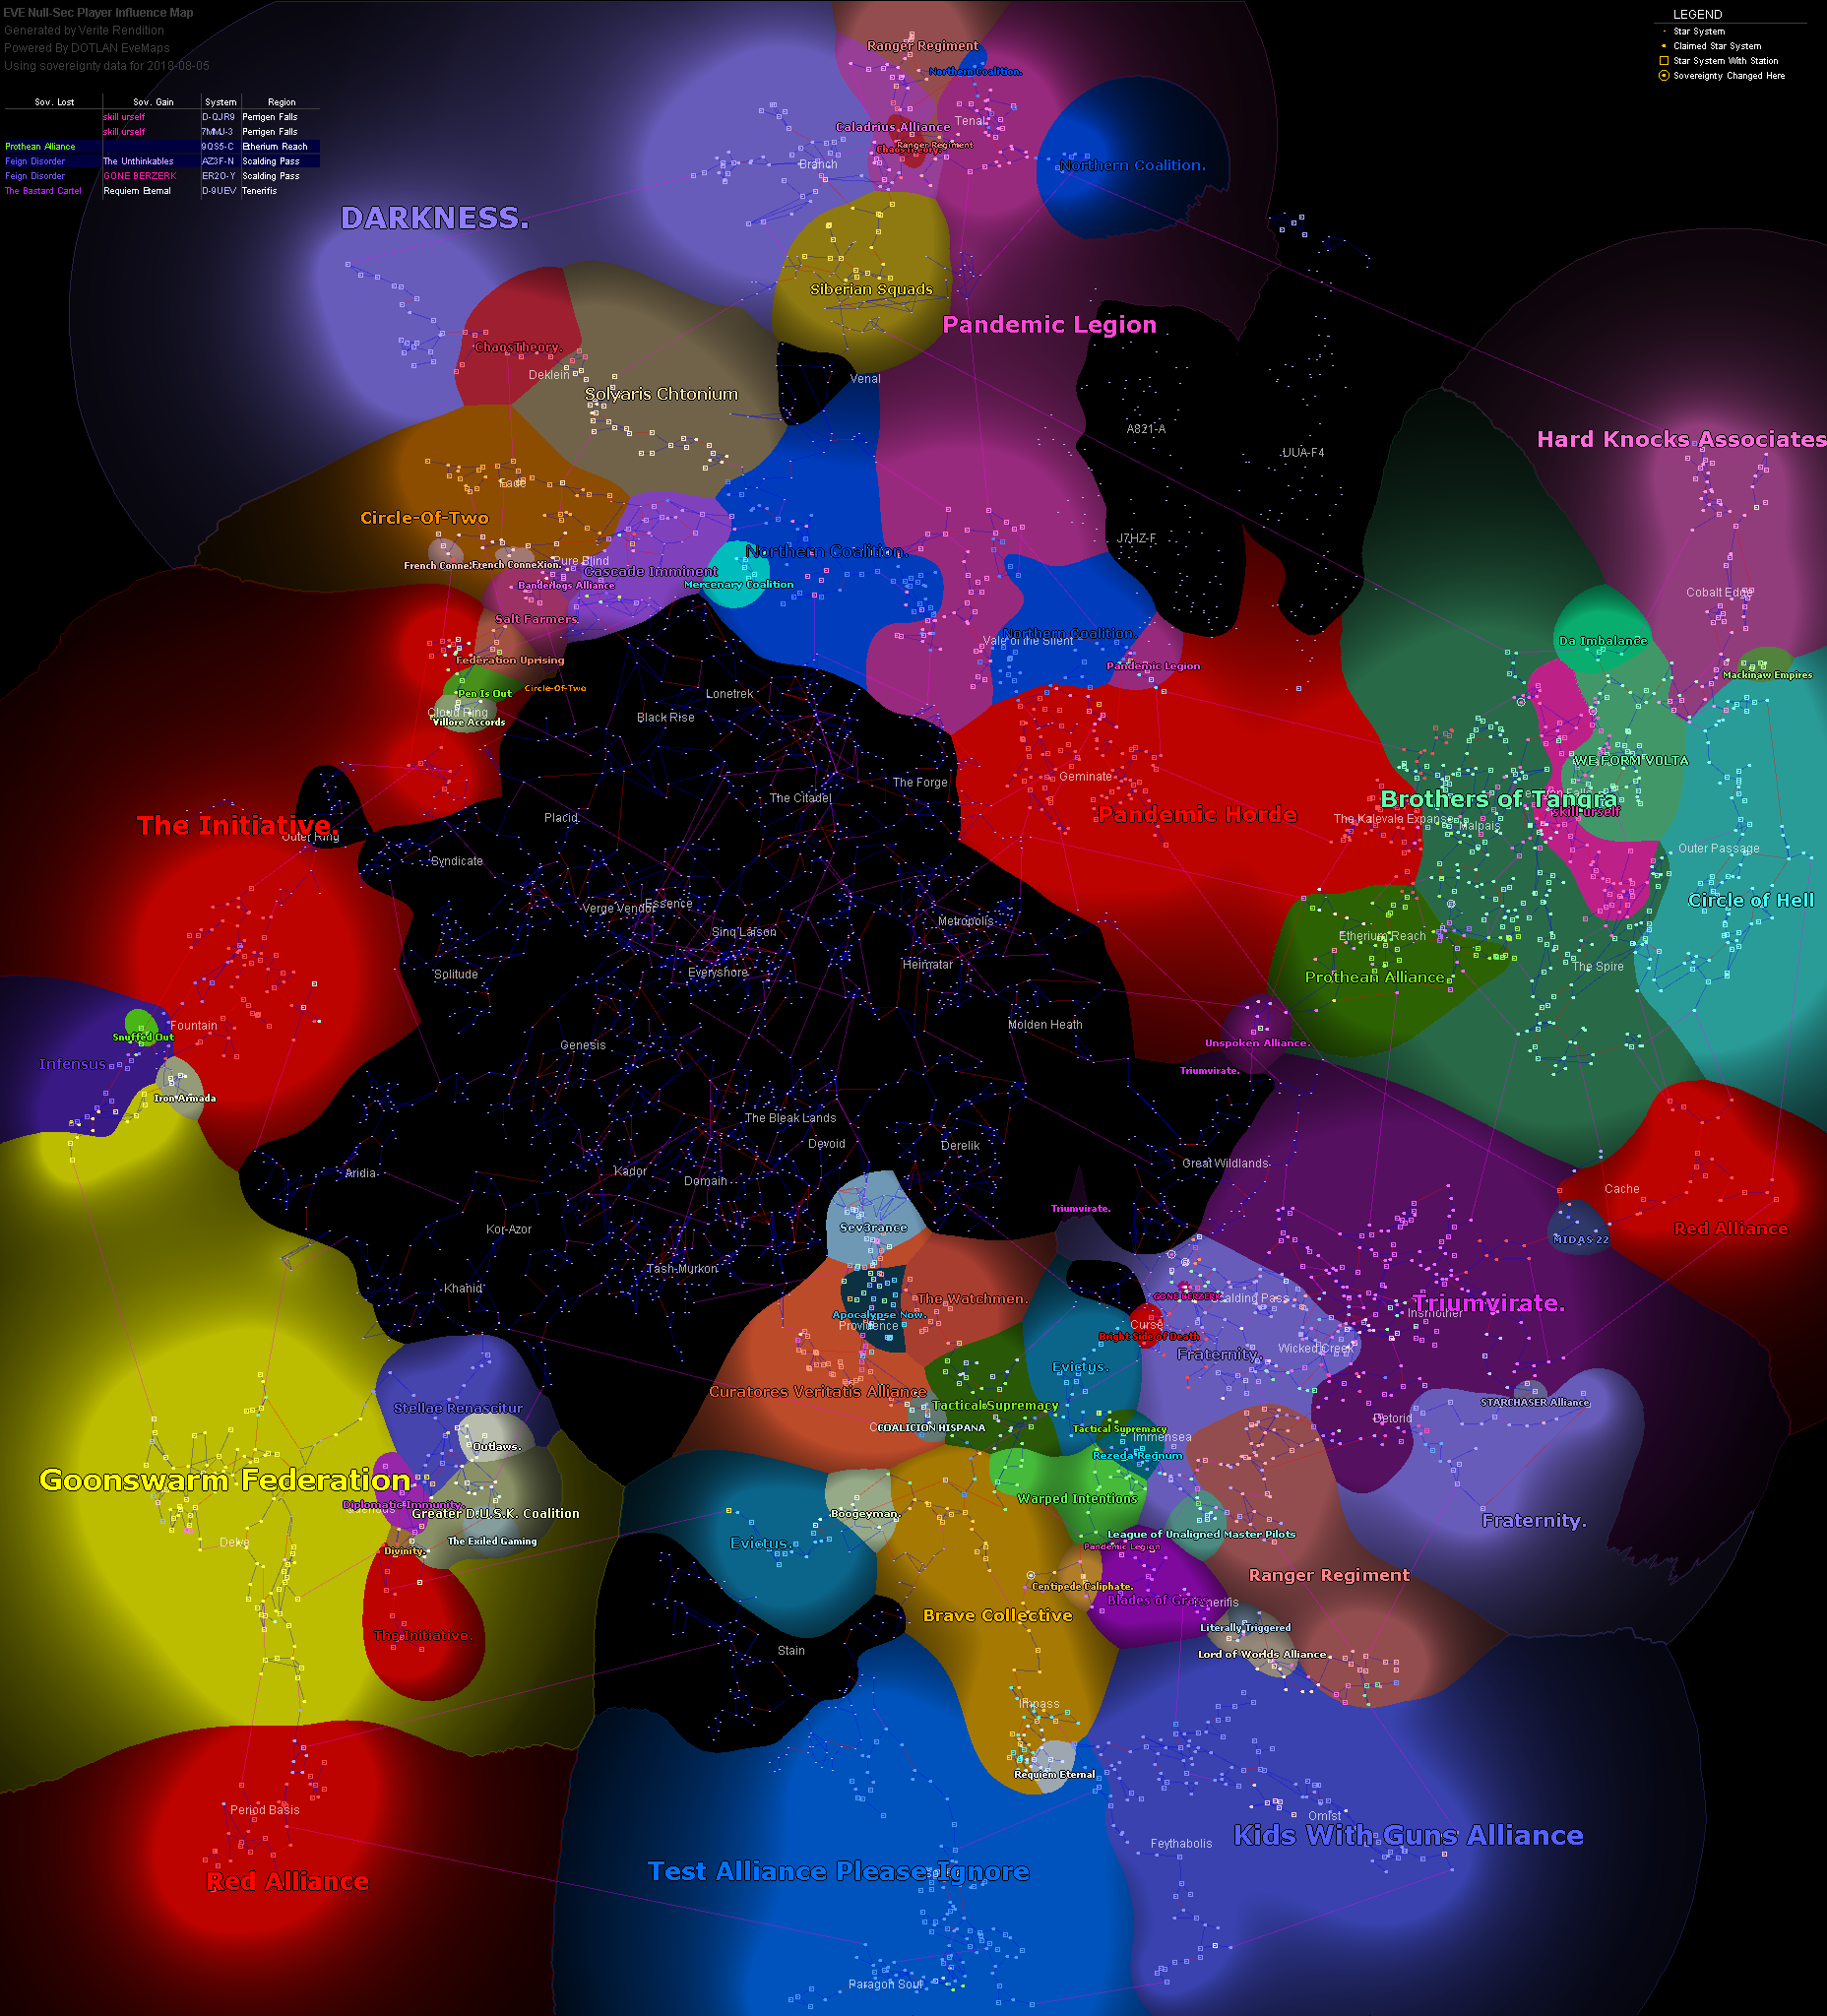
From the comments so far, a lot of people are having trouble with the scatter plot. It is a 2D map of the Eve Unvierse with dots for systems that contain that moon type or are of that region. I thought that adding The Citadel and The Forge would help clarify the orientation of the map. Keep the Verite Influence map in mind when looking at these plots.
Technetium


Cobalt


