
Historical Trading Performance Numbers
Posted: 2013-02-08 Filed under: industry, market | Tags: isk, pandemic legion, test 4 CommentsHaving seen TEST’s and Pandemic Legion’s Finance Report, I was inspired to pull up and analyse my own performance numbers to see how I compare to the income streams of larger alliances.
A few MySQL queries and a Pivot Table later, I have some performance numbers for 2010-2012. Turns out I have an average of 2.33% the income of Pandemic Legion.
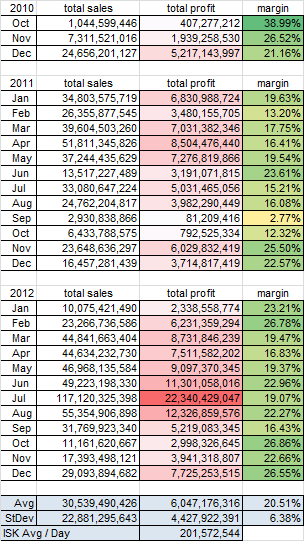
September through October of 2011 was a period where I lost faith in CCP’s ability to deliver new and inspiring content. That lack of interest was directly shown in these performance numbers as I stopped logging into the game.

I presume july 2012 jump is due to taking on a partner? very nice looking
I’m guessing the July 2012 jump had to do with your speculation activities in Mining Barge Teircide. The speculation with the BPO changed as well all the new shiny Mining Barges from the Summer expansion last summer.
Yes, Procurer speculation contributed heavily to that month.
I am always impressed by your extraordinarily high profit margin, no matter when it comes to capital manufacture or just trading.