
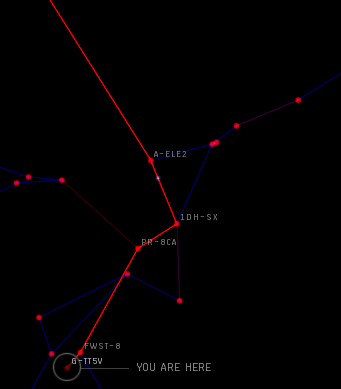
Relocating Capital Building Operations
Posted: 2013-12-18 Filed under: industry, market, nullsec, ships | Tags: archon, chimera, delve, fountain, G-TT5V, moros, naglfar, nidhoggur, revelation, thanatos Leave a commentWith the stabilization of the Fountain and Delve regions over the past few months, the amount of sales we have seen in our building system have decreased. Raath made a command decision to leave the region in search for greener pastures.
Operation Performance
Our time in G-TT5V spanned 385 days where we built 162 capital hulls to sell on the local market. Our sales totaled 221.4 B ISK with a total profit coming in at 43.3 B. Performance metrics show a margin of 4.1%, an average of 3.4 B per month in profit, and a velocity of 5.06 hulls moved per week.
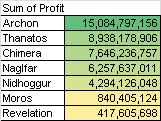
Top Performers
Given the balance changes to the Naglfar hull that came in the Odyssey update, we have seen a very strong demand the the hull; it is not a surprise that it has been a top performer. If you want to mass build, pick the Archon or Thanatos.

Capital Hull Profit Margins Trends
Posted: 2013-12-06 Filed under: industry, market, ships | Tags: archon, chimera, moros, naglfar, nidhoggur, revelation, thanatos Leave a commentAfter two months of Eve downtime to move across the country to start a new job, I wanted to report on how Capital sales have been performing as Raath has been leading the construction of capitals hulls in my absence.
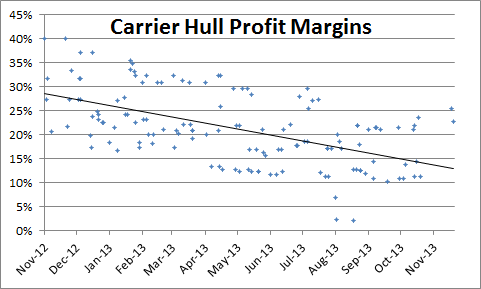
Carrier Hulls
Looking at sales from 2012-06 to 2013-11, we are faced with shrinking margins on Carriers. With 139 data points covering over a year of sales, I think it is fairly easy to justify a trend from the data. The highest demand we saw was when TEST was defending Fountain, as the Slowcat doctrine was a training goal for a lot of pilots.
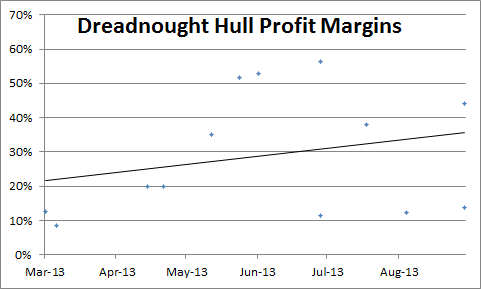
Dreadnought Hulls
We have a much smaller dataset to work with for Dreadnoughts as the BPOs and workflow for incorporating them into the production line was a fairly recent addition. With only six months of sales data, it is hard to draw a strong conclusion but the margins look to be holding stronger than Carriers. I attribute a lot of our strong numbers holding Dreadnoughts up primarily due to the Naglfar rebalance in the Odyssey expansion; their profit margins are holding up around 40% on average due to demand, and plus it is cool vertical hull.
Note: we are not building the Phoenix hull due to general terribleness.
Trading 204: Cross-Selling
Posted: 2013-08-30 Filed under: market, ships | Tags: loki, tech 3, tengu 3 CommentsModular Possibilities
A Tech 3 ship is a great example of an item that has high cross-selling opportunities. A Tech 3 hull by itself it useless; a person must assemble it by combining it with five Subsystem components –defensive, electronic, engineering, offensive, and propulsion. This requirement for flying the ship gives a trader the ability to also stock the necessary Subsystems and increase potential profits.
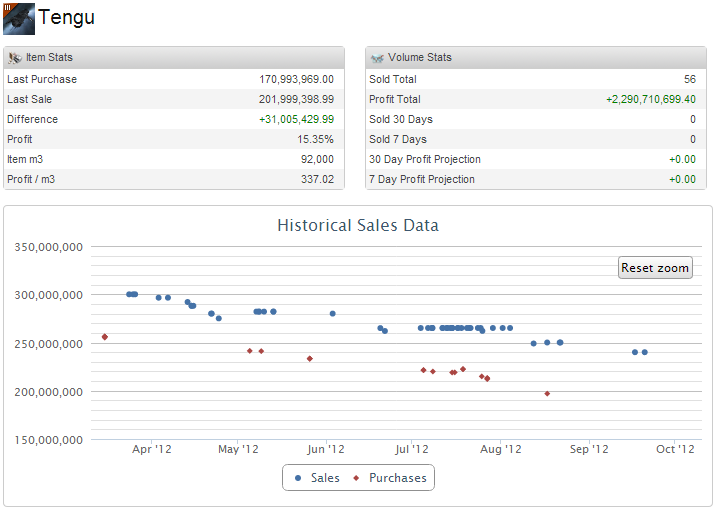
Tengu Hull Performance
I have found the Tengu hull to have the most volume out of the four racial Tech 3 hulls due to it’s PVP and PVE applications. The Loki hull is a close second, but it out-shined by the demand of the Tengu.
Over 473 days of trading I’ve sold 56 Tengu hulls. Moving 14.7 B ISK, I was able to achieve a 2.29 B total profit with the average profit per hull coming in at 41.65 M.
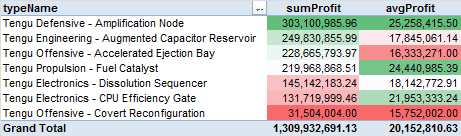
Tengu Subsystem Performance
The real trading power comes from using some intelligence and trending to find the most popular Subsystems. My analysis shows that the Amplification Node was the most profitable and also had the highest average profit. The Fuel Catalyst is also a strong performer as it had the second highest average profit. At the bottom of the list was the Covert Reconfiguration as I accredit the cloakey role to be a very niche role.
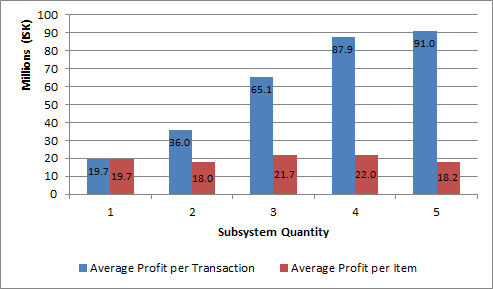
Cross-selling Performance
25 of the Tengu hull sales included the same client buying one or more Subsystems at or around the same time. On average a person bought 2.6 Subsystems with an average total of 52.4 M profit.
Further analysis shows that the best performance comes from also selling a person 3-4 Subsystems when they are also buying the Tengu hull as the average profit per Subsystem for these transactions types comes in at 21.7-22 M.
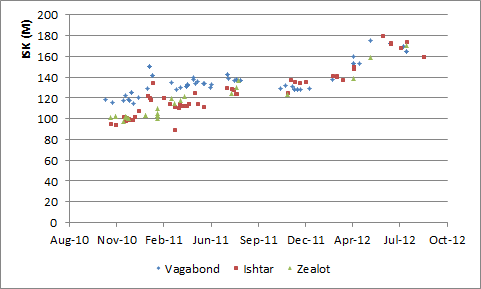
HAC Price Volatility
Posted: 2013-08-20 Filed under: market, ships | Tags: ishtar, vagabond, zealot 1 CommentLockefox got me thinking about my instincts for trading HACs a few days ago. I have always felt the Ishtar’s price to be historically less volatile than then Zealot so I went out to run the numbers and prove my theory.

Annualized Volatility

P = time period
Results
The numbers show that I was correct. If you want something stable to trade, go with the Vagabond. Higher risk items include the Ishtar and Zealot hulls.
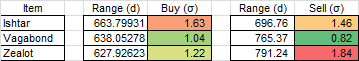
Here is a snapshot of the historical buy prices for reference.
Naglfar Bubble
Posted: 2013-08-02 Filed under: market, ships | Tags: dreadnought, naglfar Leave a commentIn the Odyssey patch the split weapon system was removed from the Naglfar hull bringing with it increased demand for the Dreadnought hull. Having just come into possession of a ME8 BPO, we quickly put it into production as I knew the demand was going to grow.

What we’ve seen over the past 5 months due to the increased demand was a large increase in the price. Sales have been quick showing that there is a strong demand.
The capital market is quite different than any other market I have worked with. The barrier to entry is high due to the core profits coming from owning a complete set of BPOs, the timescale is measured in weeks due to the building of parts that go into hull construction, and the demand can shift due to a change in popularity.
In contrast to the Cruiser market where a single BPO can make the hull, a unit can be delivered in 2 hours, and almost all of the hulls are in demand, the differentiators set capital production in a league of its own.
